Rick’s Featured Trade Ideas
Today’s featured trade idea and my personal trade plan
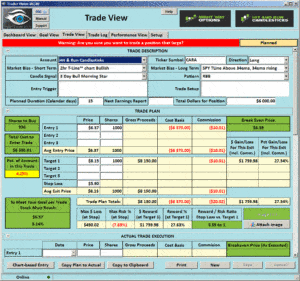
CARA | 4-day Morning Star | Daily RBB
Double click the trade plan to enlarge
 Good Morning, Profit Traders,
The T-Line™ is a powerful timing indicator!
The SPY bull-bear standoff continues. Despite the $219.25 line that seems to be keeping the bulls at bay, the bull is still in charge. Price continues to crawl — and I do mean crawl — upwards. Just in case you have forgotten, I wanted to remind you that the 2 August Shooting Stars are lurking, and they are the $219.25 resistance line. $217.07 and now the 34-EMA remain a good support area.
A comment from a member yesterday:
4:16 pm from JFlyer: “Ladies and gents. I’ve been trading stocks and options on and off for 20 years. Some good; some bad. I’ve been in an endless number of forums. Never have I experienced anything as honest, steady and of high quality as this room. I advise you to give RWO a try. If nothing else happens, you’ll still get a great education.”
All the best to your trading success!
Rick | Hit and Run Candlestick Team
Trading knowledge ignites successful stock trading.
—————————————————————————————–
Members Daily Trade Ideas. Be aware of sudden market changes!
This list is reserved for subscribed members
Reserved for Members
These are the stocks I put on my watch list to trade. I focus on these stocks for Swing Trades and the potential 10% – 40% gains. You must follow your trading rules for entry stops, profits or losses. Remember to check for earnings!
Keep your eye on the inverse ETF’s They trade well!
———————————————————————-
Based on the close yesterday | Watch for the change
SPY: T-Line™ & 2-hour chart | T-Line above 34-ema
IWM: T-Line™ & 2-hour chart | T-Line above 34-ema
SMH: T-Line™ & 2-hour chart | T-Line above 34-ema
IYT: T-Line™ & 2-hour chart | T-Line above 34-ema
DIA: T-Line™ & 2-hour chart |T-Line above 34-ema
USO: T-Line™ & 2-hour chart | T-Line below 34-ema
UUP: T-Line™ & 2-hour chart | T-Line above 34-ema
VIX: T-Line™ & 2-hour chart |T-Line below 34-ema
Investing and Trading involves significant financial risk and is not suitable for everyone. No communication or chat sessions should be considered as financial or trading advice. All information is intended for Educational Purposes Only.
VXX S&P 500 VIX Short Term Futures: A close above the T-Line ™ implies the bullish short-term swing traders are in control. A close below the T-Line ™ implies the bearish short-term swing traders are in control.
Energy Sector: XLE, SX90, ERX, USO A close above the T-Line ™ implies the bullish short-term swing traders are in control. A close below the T-Line ™ implies the bearish short-term swing traders are in control.
SMH: A close above the T-Line ™ implies the above short-term swing traders are in control. A close below the T-Line ™ implies the bearish short-term swing traders are in control.
IYT: A close above the T-Line ™ implies the above short-term bullish swing traders are in control. A close below the T-Line ™ implies the bearish short-term swing traders are in control.
US Dollar Index: UUP, DXYO A close above the T-Line ™ implies the bullish short-term swing traders are in control. A close below the T-Line ™ implies the bearish short-term swing traders are in control. Learn more about the T-Line – Click Here
The information in this email and Blog Post are notes to myself and should NOT be construed as financial or trading advice.
Investing and Trading involves significant financial risk. No communication should be construed as financial or trading advice. All information provided is for Educational Purposes Only.
Investing and Trading involves significant financial risk and is not suitable for everyone. No communication or chat sessions should be considered as financial or trading advice. All information is intended for Educational Purposes Only.
http://hitandruncandlesticks.com Trading for Profit is not an investment advisory service, nor a registered investment advisor or broker-dealer and does not tell or suggest which securities or currencies customers or subscriber should buy or sell. The analysts and employees or affiliates of Company may hold positions in the stocks, currencies or industries discussed here.


