Rick’s Featured Trade Ideas
Today’s featured trade idea and my personal trade plan
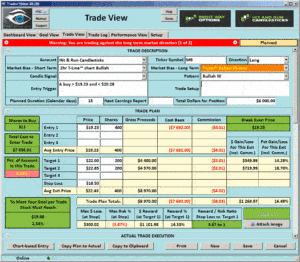
MB Long | Bullish “W” pattern breakout
Double click the trade plan to enlarge
 Good Morning, Profit Traders,
T-Line™ below the 34-ema (SPY) — Another up day for the SPY yesterday but still going nowhere. Price remains under the 50-sma, and $217.40 is the next price resistance for the bulls to work through and the bears to defend. I am still not very bullish on the SPY or the DIA’s; IWM and QQQ’s look a little better. I am bullish on a lot of charts. There are some very nice charts out there ready to produce double-digit gains. (That’s what makes trading fun).
We continue to see profits emerge from the HRC and RWO members, and the trade ideas coming from the trading rooms are fantastic!
Trading education builds confidence – Together they build profits!
Rick & Hit and Run Candlestick Team
Members Daily Trade Ideas. Be aware of sudden market changes!
This list is reserved for subscribed members
PLEASE READ!
CWEI was a member trade ideas on June 22, 2016 the stock is now up 211%. Not all of our trade are 200% trades but we do get a lot of double digit winners. Tell me why you are not a subscriber to our membership and I will do what I can to fix that!
We offer affordable membership and private coaching. Take the next step Click Here
You’re not a member because you don’t have the time? Work at a full-time job? Keep reading our emails, we will have an answer soon.
These are the stocks I put on my watch list to trade. I focus on these stocks for Swing Trades and the potential 10% – 40% gains. You must follow your trading rules for entry stops, profits or losses. Remember to check for earnings!
Keep your eye on the inverse ETF’s They trade well!
Continue Reading
Rick’s Featured Trade Ideas
Today’s featured trade idea and my personal trade plan
MB Long | Bullish “W” pattern breakout
Double click the trade plan to enlarge
 Good Morning, Profit Traders,
T-Line™ below the 34-ema (SPY) — Another up day for the SPY yesterday but still going nowhere. Price remains under the 50-sma, and $217.40 is the next price resistance for the bulls to work through and the bears to defend. I am still not very bullish on the SPY or the DIA’s; IWM and QQQ’s look a little better. I am bullish on a lot of charts. There are some very nice charts out there ready to produce double-digit gains. (That’s what makes trading fun).
We continue to see profits emerge from the HRC and RWO members, and the trade ideas coming from the trading rooms are fantastic!
Trading education builds confidence – Together they build profits!
Rick & Hit and Run Candlestick Team
Members Daily Trade Ideas. Be aware of sudden market changes!
This list is reserved for subscribed members
TOO
APA
MB
CZZ
GORO
QUOT
RDUS
CMRX
SEM
MRTX
CLDX
These are the stocks I put on my watch list to trade. I focus on these stocks for Swing Trades and the potential 10% – 40% gains. You must follow your trading rules for entry stops, profits or losses. Remember to check for earnings!
Keep your eye on the inverse ETF’s They trade well!
Continue Reading
I’m not sure what got into CAT today but it has really zoom higher in out favor. However we are short the OCT 85 calls and of course, they are being attacked.
I personally plan to continue to hold the short calls until tomorrow to see if the stock pulls back. If it does continue higher tomorrow I would suggest selling it right away. You, of course,could exit the OCT 85 calls at anytime you choose. Without the short calls, the long NOV calls would have a nice 22% overall gain the position so far.
So you decide, get out now or wait until tomorrow to see if the stock pulls back for a better price on the exit.
Trade Wisely,
Doug
Click Here To Watch the Video
Rick’s Featured Trade Ideas
Today’s featured trade idea and my personal trade plan
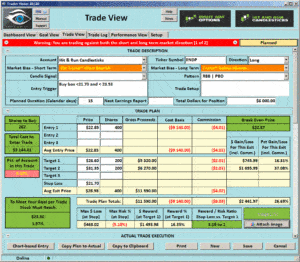
ENDP Long | RBB pattern | (PBP)Pull back opportunity
Double click the trade plan to enlarge
 Good Morning, Profit Traders,
T-Line™ below the 34-ema (SPY) — The sellers remain in control of the chart from the eyes of a swing trader, despite yesterday’s Bullish Engulf. Candlesticks are only 1 piece of the swing trading puzzle. Trends, support, and resistant are 3 more pieces that are needed and depending on your personal plan there may be more.
Sellers have kept the price under pressure only allowing brief and minor moments of light to peak in, not enough to spark a bull rally that has any meaning. While I am bearish on the SPY I am bullish on many individual stocks.
Members of Hit & Run Candlesticks and Right Way Options have remained profitable by following a plan for each trade and trading the chart in front of us. We remain profitable because of the solid education and confidence.
In the past 90-days, Hit & Run Candlesticks has closed 22 double digit winners, 8 single digit winners.
Right Way Options has produced over a 70% win rate with double and triple digit winners, total success.
Rick & Hit and Run Candlestick Team
Members Daily Trade Ideas. Be aware of sudden market changes!
This list is reserved for subscribed members
This is a list of stocks from our public webinar last night
HALO
CEMP
TTMI
GIMO
PRTA
ENDP
CSC
BDX
FOLD
MRTX
CLDX
BOFI
NVDA
EGRX
These are the stocks I put on my watch list to trade. I focus on these stocks for Swing Trades and the potential 10% – 40% gains. You must follow your trading rules for entry stops, profits or losses. Remember to check for earnings!
Keep your eye on the inverse ETF’s They trade well!
Continue Reading
Rick’s Featured Trade Ideas
Today’s featured trade idea and my personal trade plan
ENDP Long | RBB pattern | (PBP)Pull back opportunity
Double click the trade plan to enlarge
 Good Morning, Profit Traders,
T-Line™ below the 34-ema (SPY) — The sellers remain in control of the chart from the eyes of a swing trader, despite yesterday’s Bullish Engulf. Candlesticks are only 1 piece of the swing trading puzzle. Trends, support, and resistant are 3 more pieces that are needed and depending on your personal plan there may be more.
Sellers have kept the price under pressure only allowing brief and minor moments of light to peak in, not enough to spark a bull rally that has any meaning. While I am bearish on the SPY I am bullish on many individual stocks.
Members of Hit & Run Candlesticks and Right Way Options have remained profitable by following a plan for each trade and trading the chart in front of us. We remain profitable because of the solid education and confidence.
In the past 90-days, Hit & Run Candlesticks has closed 22 double digit winners, 8 single digit winners.
Right Way Options has produced over a 70% win rate with double and triple digit winners, total success.
Rick & Hit and Run Candlestick Team
Members Daily Trade Ideas. Be aware of sudden market changes!
This list is reserved for subscribed members
This is a list of stocks from our public webinar last night
HALO
CEMP
TTMI
GIMO
PRTA
ENDP
CSC
BDX
FOLD
MRTX
CLDX
BOFI
NVDA
EGRX
These are the stocks I put on my watch list to trade. I focus on these stocks for Swing Trades and the potential 10% – 40% gains. You must follow your trading rules for entry stops, profits or losses. Remember to check for earnings!
Keep your eye on the inverse ETF’s They trade well!
Continue Reading
Here is my go-to list when I looking for an inverse ETF to hedge my portfolio or take advantage of a market of sector sell-off. Be aware there are ETF’s on the list that are 2 times and 3 times short. ETF’s of this nature are meant for short term trades and should not be considered as long term positions.
I always recommend doing your due diligence on all ETF’s because they are not all created equally. It is up to you know what your trading and its intended use.
Click Here to Download the Core Short List in PDF format.
I spent about a year putting together an ETF list in an attempt to cover as many areas of the market as possible. I researched each one and they were selected by overall volume, fee structure, diversification and several other aspects. There are clearly ETF’s in this list that are not diversified such as GLD which is only invested in gold but were included on the list to gain access to that sector with reasonable fees and a good volume.
I created this ETF list for several reasons. Feel free to explore this list and use it any way you see fit.
- A go-to list that I could quickly find sectors breaking out or sectors that were losing favor with investors. I could then drill down to quickly find individual stocks that may be worthy of trading. It is also and simple way to find possible sector rotations.
- An ETF list that could be used for finding option directional or spread trading opportunities. There have been times when I have found as 20 good spread trades per month. Other times when there are few productive trading setups.
- I also use this list when looking for longer term positions as a core portfolio of diversified ETF’s. From this list, it is possible to build conservative, moderate or aggressive portfolios that have much lower costs than mutual funds.
Click Here to Download the list in a PDF Format
Good morning everyone. After the presidential debate lat night the futures popped up over 100 points but I guess sometime during the night the market realized that nothing really changed so they begin to normalize and it looks like we can expect just a slightly higher open.
Oil is lower this morning by more than $1 a barrel which could make it tough for the markets to really gain much ground. There are a couple economic reports this morning but I think it’s unlikely they will move the market…However, we have Fed member speaking today and as you know they can create big moves if his speech is is perceived as dovish or hawkish.
The disappointing thing is our market seems to be completely dependent on the news cycle right now. As you know the biggest moves are occurring during the pre-market and after that it just can’t seem to gather enough energy to anything other than chop. It makes for some tough trading indeed. If your a bit frustrated, you are not alone!
Trade Wisely,
Doug
Click Here to Watch The Video


