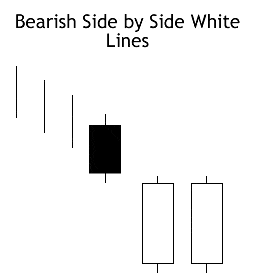
They’re two of a kind, a perfect pair, practically twins: the two white candlesticks in the Bearish Side by Side White Lines pattern are the same color and roughly the same size. But despite their aesthetic similarities, they’re actually trying to tell investors about a moment of discord. For two days in a row, the exact same thing has happened. No progress has been made. What’s going on? To better understand what the Bearish Side by Side White Lines pattern is trying to say, scroll down.
Bearish Side by Side White Lines
Formation
Three candles make up the Bearish Side by Side White Lines pattern: white twin candles and a smaller black candle. Each pattern conveys something different about the state of the market, so it is important that you grasp the details of their formation. Look for these criteria:
First, a downtrend must be in progress. Second, a black (or red) candle must appear, continuing the downward price trend. Third, two white (or green) candles should appear below the body of the first candle (with a gap down between the first and second candle). The bodies of the second and third candles should be a similar size, and they must open and close at the same price (more or less).
NOTE: Although known as the Bearish Side by Side White Lines, remember that the colors white and green can be used interchangeably to convey that a candle is bullish.
The pattern’s brother, the Bullish Side by Side White Lines, occurs during an uptrend and contains a small white candle followed by twin white candles. When you see it, you can expect the uptrend to continue.
Meaning
The price is declining under the control of the bears. The downward push is so dramatic that there is a gap down before the second day. However, the tables turn when the bulls take the reins. During the second day, the price jumps up, creating a long white candle. Wonderful, right? Not so fast. On the third day, the price opens at the same place it did on the previous day. The bulls give it another ago, and they raise the price just as much as they did on the second day.
Despite the bulls’ valiant effort, we can expect the downtrend to continue. They simply don’t have the strength to overturn the bears, and their attempt to rally has failed. The longer the length of the twins, the stronger the signal.
_____
The Bearish Side by Side White Lines pattern isn’t common, but it is a strong indicator with an unambiguous message. Nevertheless, trusting a candlestick pattern can be tricky. Before you make any major moves, confirm the pattern’s forecast by waiting for a black candle, a downward gap, or a lower close.
If you’re interested in mastering some simple but effective swing trading strategies, check out Hit & Run Candlesticks. Our methods are simple, yet powerful. We look for stocks positioned to make an unusually large percentage move, using high percentage profit patterns as well as powerful Japanese Candlesticks. Our services include coaching with experienced swing traders, training clinics, and daily trading ideas. To sign up for a membership, please click here.


Comments are closed.