Last Updated: June 20, 2016
Will you do me a favor? Picture a punt kick. A football player drops a ball, kicks it forcefully before it hits the ground, and then watches (along with crowds of cheering spectators) as the ball flies up toward the sky. Now, as you try to identify and memorize the Bullish Kicker candlestick pattern, use that image as a reference. Somewhat like a punt kick, the price drops down and then kicks back up with a gap forming between the first and second candle (i.e., the grass and the ball), indicating an abrupt change in sentiment. To learn more about this kicky candlestick signal, please scroll down . . .
Bullish Kicker Candlestick Pattern
Formation
To identify a Bullish Kicker candlestick pattern, look for the following criteria:
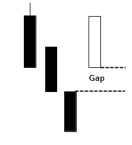
First, the first candle needs to be a black or bearish candlestick. Second, the second candle (which is white or bullish) must open above the close of the first candle, forming a gap. Third, the movement of the price during the formation of the second candlestick should never drop into the gap formed between the first and second candle. As you might have guessed, this means that there is rarely a bottom wick on the second candlestick.
The Bullish Kicker candlestick pattern doesn’t need to form after a significant downtrend, but it often does. When this happens, the sudden change in attitude is likely due to a game-changing news event.
Finally, if you spot a pattern with the opposite formation (a white candle followed by a black candle that gaps down and never rises into the gap), you may have a Bearish Kicker on your hands. It is a bearish reversal signal that heralds further downward movement. Like the Bullish Kicker, the Bearish Kicker proves rare but reliable.
Meaning
The first candle in the signal continues with the current trend, moving downward, but then a major event causes the second candle to gap up. The price bursts upward with bullish enthusiasm. Thus, the Bullish Kicker candlestick pattern portrays a strong change in investor opinion. Not only is there a bullish candle following a bearish candle, but the strength of the switch resulted in a gap between the two candles.
The Bullish Kicker signal often occurs after a major surprise in the news that is announced before or after market hours. Something drastic has happened, causing a great shift in investor sentiment, and a reversal will inevitably follow. The larger the gap between the two candles, the more significant the signal.
Examples
Sometimes it is difficult to translate classroom lessons to the real world. For example, although you can easily discern a Bullish Kicker candlestick pattern when it is presented on its own, can you imagine what it will look like in the middle of a candlestick chart? To get a better handle on the formation of the Bullish Kicker and to see how it might pop up during the course of a trading session, review the trio of examples below.

EXAMPLE 1:
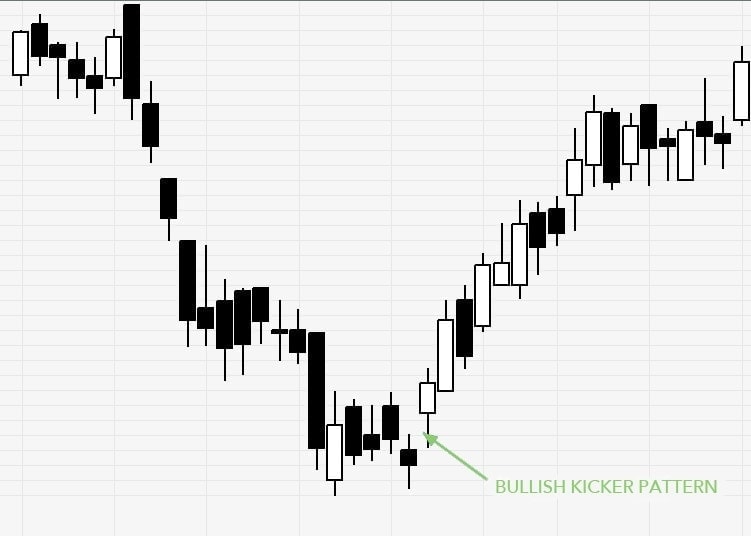
As you can see, the lowest black candle on the chart is followed by a gap up and a white candle, creating a Bullish Kicker. Although the second candle has a substantial lower wick, it doesn’t enter the first candle’s body. This is crucial, because if it did, the Bullish Kicker would not exist because the wick would close the gap between the candles. It is okay, however, that the candles’ wicks cross paths. Following the pattern, as expected, a reversal occurs and an uptrend begins. Although peppered with black candles, the upward price movement is strong, creating a steep escalation.

EXAMPLE 2:
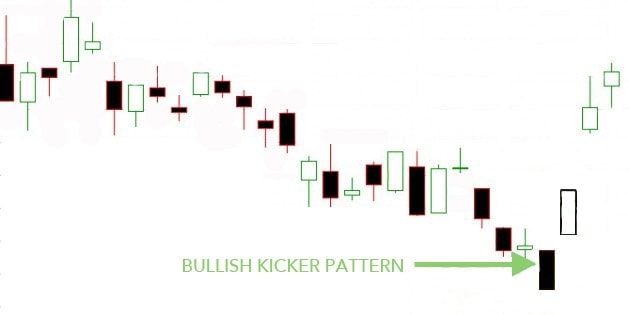
On this chart, the Bullish Kicker candlestick pattern is more dramatic. Neither of the candles involved has wicks, so the gap between them is clear. The gap is also wide, increasing the pattern’s significance and reliability. Following the Bullish Kicker pattern, a vast gap appears, followed by a pair of white candles. The signal proved successful in predicting the future. Confident investors will be rewarded for trusting this Bullish Kicker.
EXAMPLE 3:
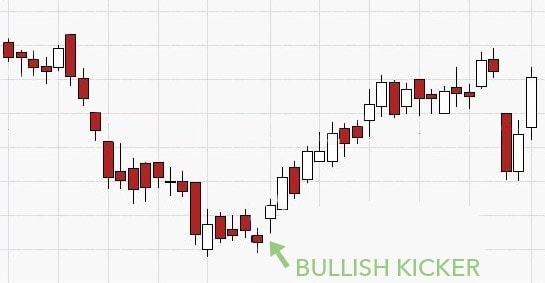
In our last example, both candles have two wicks. Crucially, the white candle’s bottom wick doesn’t extend into the red candle’s body. As you have learned, the signal heralds a bullish reversal, which occurs directly thereafter. Following the gap, there are several white candles (and only one red) and the price moves consistently upward. Although the steady uptrend eventually gaps down (and is followed by a strong bearish candle), that jump in price doesn’t dampen the Bullish Kicker’s success. Any investors relying on the pattern’s prophetic reliability would certainly be pleased.
CONCLUSION
Explosive and powerful, the Bullish Kicker should not be overlooked. Most traders place it amongst the strongest and most influential candlestick patterns in existence, so when you spot it, be prepared for action! Although you would typically confirm the reversal by checking for more bullish movement (continued uptrend, white candles, a gap up), the Bullish Kicker candlestick pattern is a strong indicator of change on its own. Buyers are undoubtedly taking control of the stock, so if you’re ready to embrace a bit of risk, feel free to jump right in.
However, the Bullish Kicker candlestick pattern is also unfortunately rare. Traders don’t often change their opinion of a stock so dramatically and quickly. They tend to be more moderate, slowly shifting one way or the other. Because of this, when you do spot the Bullish Kicker, it is important that you pay attention. Unlike many other candlestick patterns, when the Bullish Kicker appears, it packs a punch (or should I say a kick?). It doesn’t whisper its message—it shouts!
If you’re interested in mastering some simple but effective swing trading strategies, check out Hit & Run Candlesticks. Our methods are simple, yet powerful. We look for stocks positioned to make an unusually large percentage move, using high percentage profit patterns as well as powerful Japanese Candlesticks. Our services include coaching with experienced swing traders, training clinics, and daily trading ideas. To sign up for a membership, please click here.


Comments are closed.