
Japanese Candlesticks are gaining popularity among individual traders, mainly because they are easier to learn and interpret versus bar charts.
Of equal importance is the fact that they fall into the category of leading indicators.

Unlike lagging indicators (for example; a moving average) which appear after the fact, the Japanese Candlesticks signals are leading indicators because they provide early warning alerts to possible price movements. When you see one of these alerts confirmed by moving averages, they can provide profitable trade opportunities.
I’ve provided detailed explanations and illustration for each of the Major Japanese Candlestick Signals below. Click on the signal below.
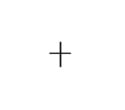
A single candlestick that indicates indecision –
(1) The opening price and the closing price are almost the same. This is depicted by the horizontal line.
(2) There is an upper tail/shadow and lower tail/shadow This is depicted by the vertical line.
(3) Most meaningful when it is displayed as part of a candlestick pattern.
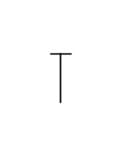
A single candlestick – bullish doji
(1) Price opens at the high of the session, has a large decline during the session and then price closes at the high of the session.
(2) There is a long lower tail and no upper tail.
(3) Most meaningful when it is displayed in a downtrend where bearish candlesticks precede it.
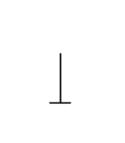
A single candlestick – bearish doji
(1) Price opens at the low of the session, has a large rally during the session and closes at the low of the session.
(2) There is a long upper tail and no lower tail.
(3) Most meaningful when it is displayed in an uptrend where bullish candlesticks precede it.
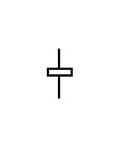
A single candlestick that indicates indecision –
(1) The closing price is slightly above the opening price. This is depicted by the white box.
(2) There is an upper tail and a lower tail.
(3) Most meaningful when it is displayed as part of a candlestick pattern.
A single candlestick –
(1) The opening price is at the low of the session. Price rallies during the session and closes at or near session highs. This forms a white or bullish candlestick.
(2) There is usually no lower tail and a small or no upper tail.
(3) The longer the candlestick the more powerful the signal.
(4) Best if this appears after a downtrend and then followed up with a bullish candlestick the next session.
A two candlestick pattern –
(1) Definable downtrend in progress.
(2) White or bullish candlestick must completely “cover” or engulf the body of the previous black candlestick.
(3) The body of the engulfing candlestick must be the opposite color of the preceding candlestick (the exception is if the previous candlestick is a doji (a doji looks like a small letter “t” or plus sign”+”) or small bodied candlestick).
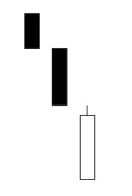
A two candlestick pattern –
(1) Definable downtrend in progress.
(2) White or bullish candlestick closes within the body of the previous black candlestick.
(3) Confirmation is required.
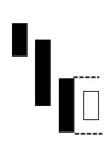
A two candlestick formation –
(1) First candlestick is black or bearish.
(2) Second candlestick opens above the close of the first candlestick forming a gap.
(3) Price during the formation of the second candlestick never drops into the gap. Thus, there is usually no bottom wick on the second candlestick.
This pattern need not occur after a lengthy downtrend. It simply indicates an abrupt change in sentiment most likely due to a news event.
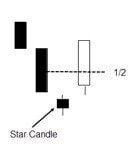
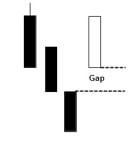
A three candlestick pattern –
(1) Definable downtrend in progress.
(2) First candlestick has a long black body indicating that the downtrend is still in progress.
(3) Second candlestick gaps away from the first candlestick and opens and closes at or near the same level. This indicates indecision.
(4) Third candlestick is a long white or bullish candlestick that gaps up from the second candlestick. This third candlestick closes at least halfway above the body of the first candlestick.
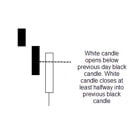
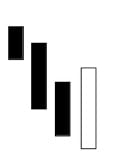
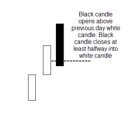
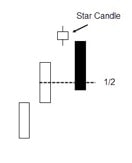
A two candlestick pattern-
(1) Definable downtrend in progress
(2) First candlestick is black or bearish candlestick
(3) Second candlestick is white or bullish. This candlestick below the previous day’s black candlestick and closes above the midpoint of the previous day’s white candlestick.
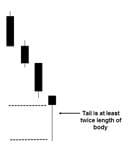
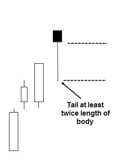
A single candlestick signal that needs bullish followup –
(1) Definable downtrend in progress.
(2) Tail of candlestick is at least twice the length of the body of this candlestick.
(3) the candlestick following the hammer candlestick needs to be bullish or white or price needs to be closing at higher levels above the hammer candlestick to indicate buying activity.
A single candlestick –
(1) The opening price is at the high of the session. Price declines during the session and closes at or near session lows. This forms a black or bearish candlestick.
(2) There is usually no upper tail and a small or no lower tail.
(3) The longer the candlestick the more powerful the signal.
(4) Best if this appears after an uptrend and then followed up with a bearish candlestick the next session.
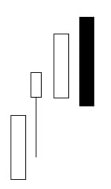
A two candlestick pattern –
(1) Definable uptrend in progress
(2) First candlestick is a white or bullish candlestick.
(3) Second candlestick is black or bearish and must completely “cover” or engulf the body of the first white candlestick.
(4) The body of the engulfing candlestick must be the opposite color of the preceding candlestick (the exception is if the previous candlestick is a doji (looks like a small letter “t” or plus sign “+” or small bodied candlestick).
A two candlestick pattern-
(1) Definable uptrend in progress
(2) First candlestick is white or bullish candlestick
(3) Second candlestick is black or bearish. This candlestick opens above the previous day’s white candlestick and closes below the midpoint of the previous day’s white candlestick.
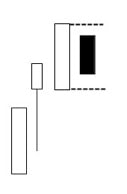
A two candlestick pattern –
(1) Definable uptrend in progress
(2) First candlestick is a white or bullish candlestick.
(3) Second candlestick is black and closes within the body of the previous white candlestick
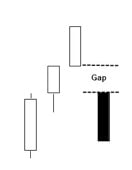
A two candlestick formation –
(1) First candlestick is white or bullish.
(2) Second candlestick opens below the close of the first candlestick forming a gap.
(3) Price during the formation of the second candlestick never rises into the gap. Thus, there is usually no top wick on the second candlestick.
This pattern need not occur after a lengthy uptrend. It simply indicates an abrupt change in sentiment most likely due to a news event.
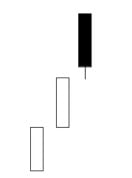
A three candlestick pattern –
(1) Definable uptrend in progress.
(2) First candlestick has a long white body indicating that the downtrend is still in progress.
(3) Second candlestick gaps away from the first candlestick and opens and closes at or near the same level. This indicates indecision.
(4) Third candlestick is a long black or bearish candlestick that gaps down from the second candlestick. This third candlestick closes at least halfway below the body of the first candlestick.
A single candlestick signal that needs bearish followup –
(1) Definable uptrend in progress.
(2) Tail of candlestick is at least twice the length of the body of this candlestick.
(3) Open and close are near the same level indicating indecision.
(4) The candlestick following the hangman candlestick needs to be bearish or black or price needs to be closing at lower levels below the hangman candlestick to indicate selling activity.
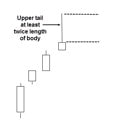
A single candlestick signal that needs bearish followup –
(1) Definable uptrend in progress
(2) The tail is above the body of the candlestick and the tail is at least twice the length of the body of the candlestick.
(3) Open and close are near the same level indicating indecision.
(4) The candlestick following the shooting star candlestick needs to be bearish or black or price needs to be closing at lower levels below the shooting star candlestick to indicate selling activity.


