
Last Updated: January 31, 2017
Star light, star bright, first star I see tonight . . . . Unfortunately, this hopeful nursery rhyme doesn’t apply in the world of swing trading, where an Evening Star candlestick pattern indicates that very bad things are on the horizon. When traders spot this pattern, which is a top reversal signal, they know that lower stock prices may soon be on the way. However, the Evening Star candlestick pattern is a tricky pattern to identify, so investors must proceed with caution when they think they’ve sighted it. Scroll down to learn a little more about this hard-to-spot signal.
Evening Star Candlestick Pattern
Formation
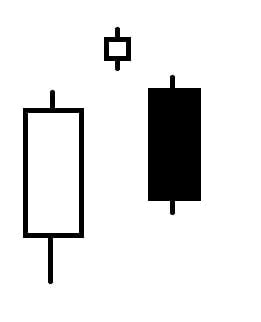
If you’re trying to confirm that an Evening Star candlestick pattern has occurred, look for the following criteria:
First, the price must be in an unmistakable uptrend (bulls in control) before the signal can occur. Second, the first day must be represented in a long white (or green) body, to continue the uptrend. Third, the second day must represent indecision through a Star candle formation or a Doji, relaying that supply and demand is fairly equal. Fourth and finally, the third day must be illustrated with a long black (or red) body that closes down at least halfway into the body of the first day’s white (or red) candle, proving that the bears have stepped in strongly and gained control. Supply is now greater than demand.
Essentially, the Evening Star is the opposite of the Morning Star, which is a bottom reversal signal that indicates good things are on the horizon.
Meaning
The Evening Star tells a story of defeat. There is a strong uptrend, and the bulls are in control. Confidence is building, but then a battle occurs. The bears and bulls share control for a short time, but then the bears seize power and take over. The lower the stock closes, the more decisive the bears’ victory.
So when traders see the Evening Star, they know that low stock prices are probably on the way. In addition, the Evening Star’s candlesticks’ characteristics can relay further information:
- The longer the candles, the greater the reversal force.
- If there is a gap between the first and second day, the odds of a reversal increase.
- If there are gaps before and after the star candle, the odds of a reversal are even higher.
- The lower the third day’s candle comes down in relation to the first day’s candle, the stronger the reversal will be.
Examples
Now that you know what the Evening Star looks like, are you ready to start stargazing? As any student knows, just because you’ve learned the facts in class, that doesn’t mean you’re ready to take the test. So before you head out into the real world, let’s do a test run. Use the examples below to test your knowledge. Do your best to spot the Evening Star pattern in each example without the aid of the big blue arrows (though we know they’re hard to ignore). Then, use the information you’ve gleaned to predict what will happen next.
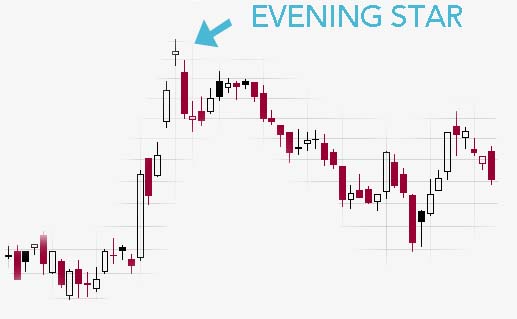
EXAMPLE 1:
When we enter this candlestick chart, the mood is uncertain and bouncing between the hands (or should I say the paws and the hooves?) of the bulls and bears. Slowly and then all at once, the bulls seize the reins. Within the uptrend, you can spot a huge white candle and two gaps up. At the top of the metaphorical mountain, however, an Evening Star candlestick pattern occurs. A long white candle continues the ascension, a doji tops off the uptrend, and it is followed by a long red candle that closes below the first candle’s midpoint. Since this Evening Star contains two gaps, the likelihood of a reversal is strong.
As expected, a downtrend begins. Unexpectedly, it doesn’t last long. After just two bearish candles and one doji, another uptrend occurs. However, this movement is also brief, and when the bears take over, they have a firmer grasp this time around. The downtrend that follows makes up nearly half the chart.
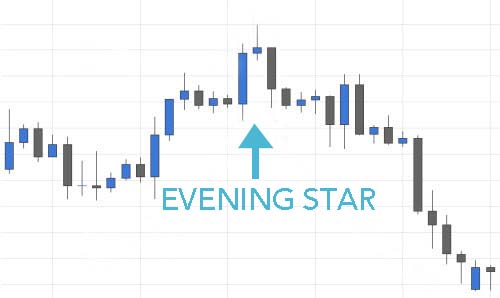
EXAMPLE 2:
In this second example, the Evening Star is conveniently located in the center of the chart. The price slowly moves up, and the uptrend ends with a long blue candle (which signifies that it is bullish). Then, of course, there is a doji and a long black candle, which begins a downtrend. Interestingly, the uptrend that precedes the Evening Star and the downtrend that follow it seem to mirror one another at parts (omitting the very beginning and the very end). Though simple, this example clearly illustrates how an Evening Star candlestick pattern typically works.
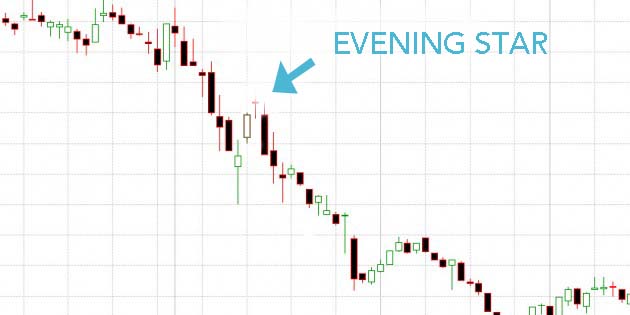
EXAMPLE 3:
This final example shows how brief the initiating uptrend can be. From afar, it might appear that this chart shows one very long downtrend. However, near the middle, a tiny uptrend occurs, consisting of two candles. The second of these bullish candles starts the Evening Star. It is followed by a Star formation and then a long black candle. The black candle closes below the white candle that began the pattern, conveying the strength of the bears. And indeed, an extensive downtrend occurs after that.
_____
Just as a star in the sky can tell you something about the rotation of the earth and the time of year, an Evening Star candlestick pattern can help you understand the sentiments of investors. However, just because they’re informative, that doesn’t mean they can’t deceive you. Like all patterns, the Evening Star is not foolproof, so don’t be hasty when you think you’ve spotted one. Instead, confirm that you’re seeing what you think you’re seeing before you move forward with any trades. Good luck!
If you’re interested in mastering some simple but effective swing trading strategies, check out Hit & Run Candlesticks. Our methods are simple, yet powerful. We look for stocks positioned to make an unusually large percentage move, using high percentage profit patterns as well as powerful Japanese Candlesticks. Our services include coaching with experienced swing traders, training clinics, and daily trading ideas. To sign up for a membership, please click here.


No comments yet.
Leave a Reply