
To amateurs and unaware young traders, the fact that candlesticks play an important role within the world of swing trading may seem absurd. How could candlesticks and the stock market possibly be related? However, the key lies within the shape of a candlestick, which resembles a very old and reliable Japanese method of graphing stocks. Known as Japanese candlestick charts, these graphs are reliable and easy to read. They allow traders to visually detect selling pressure and buying pressure by studying informative candlestick patterns.
What Are Candlestick Patterns?
Once you understand the construction of a Japanese candlestick, you’re ready to begin studying patterns and signals. A candlestick pattern is a visual representation of a price movement depicted graphically on a candlestick chart. Some patterns contain one candle, while others contain many. Some patterns are simple and easy to spot, while others are complex and elusive. Learning to spot and interpret Japanese candlestick patterns allows you to understand how the price of a stock has changed over a specified period. It also signals what’s going to happen next, allowing you to predict when a reversal or a continuation will likely occur and act accordingly.
Examples of Candlestick Patterns
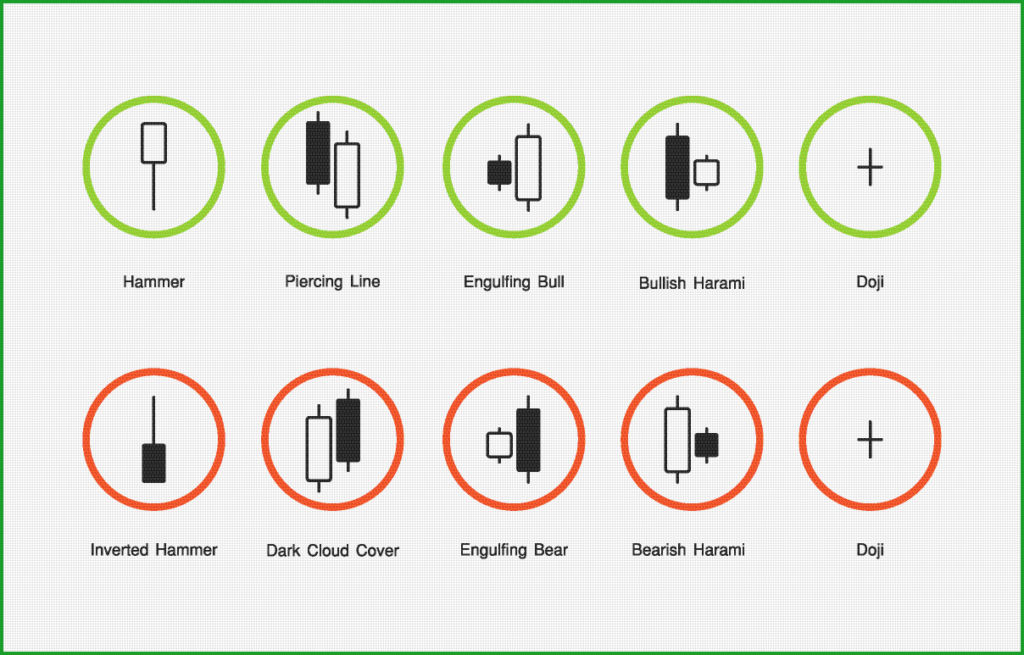
Doji: A basic Doji pattern resembles a plus sign or a cross. It has no real body (or a very small one), and its shadows vary in length. A Doji signifies indecision.
Hanging Man: The Hanging Man forms at the upper end of the trading range with a small body, a long lower shadow, and no upper shadow. Occurring during an uptrend, it indicates that a reversal is on the horizon. The longer its lower shadow, the more likely the reversal.
Hammer: Although a Hammer looks like a Hanging Man with its small body, long lower shadow, and absent upper shadow, it forms after an established downtrend and signals a reversal. The longer its lower shadow, the more likely the reversal.
Harami: A Harami occurs when, after an uptrend or downtrend, there is a long-bodied candle that is the same color as the current trend, followed by a small candle of the opposite color that opens and closes within the first candle’s body. There is both a bullish and a bearish form of the Harami pattern.
Engulfing: When a second candle (of opposing color) “engulfs” the first candle by opening higher than the previous day’s open and closing lower than the previous day’s close, Engulfing pattern forms. This signal can be bearish or bullish, depending on the colors of the candles. When you spot an Engulfing pattern, a reversal is likely just around the corner.
How to Make Money Trading Japanese Candlesticks
Although Japanese candlesticks appear confusing at first glance, once you understand the basic concept, it’s easy to spot patterns and make predictions. However, if you want to use candlestick patterns to make money, there are several things you ought to do:
First, you must accept that rewards are impossible without risks. Consider paper trading until you’re ready for the real deal. Second, always confirm a candlestick pattern before you act. This prevents hasty mistakes and big regrets. Third, have patience and remain levelheaded. If you have a hard time staying calm and rational during moments of great stress, swing trading is probably not for you. Fourth, find a charting program that you are comfortable using. Popular options include TC 2000, TOS, Fidelity, IB, Scottrade, and Schwab. Finally, consider joining a community of swing traders online, using a trading room like the one on Hit & Run Candlesticks. You’ll be able to learn new strategies, share ideas, receive encouragement from other members, and work together to solve problems.


