
TSLA Misses Big Promises More and Spikes
Tuesday saw another gap higher to start the day. SPY gapped up 0.43%, DIA gapped up 0.37%, and QQQ gapped up 0.50%. From three, all three major index ETFs gave us follow through, which was stronger for 90 minutes and then slowed, but continued higher until 2:45 p.m. From there, all three took profits very modestly into the close, to end the day not far below the highs. This action gave us gap-up, white bodied candles with modest upper wicks in all three. SPY crossed back above its T-line (8ema) while QQQ retested its own from below but came up just short of crossing. DIA remained up above its 8ema. If you squint, you might call the QQQ a Morning Star like pattern. This all happened on less-than-average volume in all three major index ETFs.

On the day, all 10 sectors were in the green with Technology (+1.96%) well out in front, followed by Healthcare and Consumer Cyclical (both +1.53%) leading markets higher. At the same time, SPY gained 1.19%, DIA gained 0.69%, and QQQ gained 1.56%. VXX fell another 3.92% to close at 13.71 and T2122 climbed again toward the upper end of its mid-range at 70.87. 10-year bond yields fell to 4.602% and Oil (WTI) was up 1.72% to close at $83.31 per barrel. So, Tuesday was a bullish day with DIA breaking up out of its consolidation while SPY and DIA turned higher. However, the downtrend has only been broken in the DIA with the two broader index ETFs still below that falling line. None of the three has put in a higher low yet. So, for now this must be considered a relief rally at the moment.
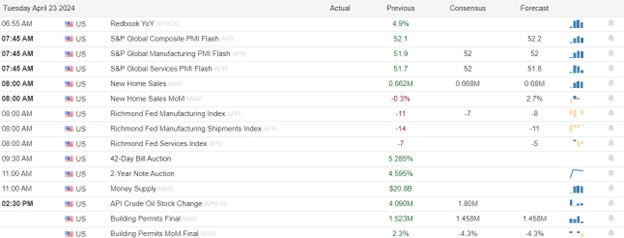
The major economic news scheduled for Tuesday included Building Permits, which came in stronger than expected at 1.467 million (compared to a forecast of 1.458 million but still down from the March reading of 1.524 million). Later, S&P Global Mfg. PMI was lower than predicted at 49.9 (versus a 52.0 forecast and a March value of 51.9). At the same time, S&P Global Services PMI also came in low at 50.9 (compared to a forecast of 52.0 and a March 51.7 value). This gave us an S&P Global Composite PMI of 50.9 that was down from March’s 52.1 reading. Later, March New Home Sales were a bit better than anticipated at 693k (versus a 668k forecast and a 637k February value). Finally, after the close, API Weekly Crude Oil Stocks showed an unexpected drawdown of 3.230 million barrels (compared to a forecast calling for an increase of 1.800 million barrels and the prior week’s 4.090-million-barrel increase).
After the close, BKR, CNI, CB, CSGP, EWBC, ENVA, EQR, MTDR, RUSHA, LRN, TXN, VLTO, V, WFRD, and WFG all reported beats on both the revenue and earnings lines. Meanwhile, AGR, EQT, IEX, MAT, RRC, STX, STLD, all missed on revenue while beating on earnings. On the other side, HA beat on revenue while missing on earnings. Unfortunately, TSLA missed big (the steepest revenue decline since 2012) on both the top and bottom lines. However, the master marketer Musk did immediately promise things for next year that made the stock soar. It is worth noting that LRN raised its forward guidance.
In stock news, on Tuesday, GOOGL announced it will invest $640 million in a new data center in Netherlands. At the same time, Reuters reported that FSRN may file for bankruptcy sometime in the next 30 days if it is unable to get enough relief from creditors or otherwise raise capital. Later, SPWR announced that its previous financials should not be relied upon and it will need to restate some 2022 and 2023 financial statements. At the same time, LHX announced it will cut 5% of its workforce during 2024 (about 2,500 employees) as part of a cost-savings push. Later, JDSPY agreed to buy HIBB for $1.08 billion ($87.50/share, almost a 21% premium on Monday’s close). Meanwhile, protest organizers say that GOOGL increased the number of employees fired over last week’s protests (over a deal with the Israeli military), bringing the total to 50. At the same time, TLSA said it will lay off 6,020 employees (3,322 in CA and the rest in TX). Later, the Wall Street Journal, reported that IBM is close to closing a deal to buy HCP. At the same time, MSFT announced it had launched a “lightweight AI model” that will be more cost-effective for customers with more limited requirements.
Elsewhere, SPR announced that it had reached a deal with BA and will receive $425 million in advanced payments to give it the capital to address higher inventories due to the slowdown of BA production amidst quality probes and concerns. Later, TSLA said it will introduce “new models” by early 2025, which will include lower-cost vehicles to better compete. (TSLA stock soared in after-hours trading on the news.) Also after the close, SQ announced it is expanding its Bitcoin mining operation by developing its own mining system. (Previously, SQ had just designed Bitcoin mining chips.)
In stock legal and governmental news, on Tuesday, the US Supreme Court heard the arguments on SBUX appeal against lower court rulings that it violated employee rights and must reinstate union organizing employees the company fired in retaliation for their union organization. (Questioning by the Justices seemed to indicate the Conservative super-majority sides with the company and wants to rule against the NRLB…or any other agency…can dictate to companies.) Later, in Canada, the merger of US-based BG with Viterra is facing pushback from the country’s Competition Bureau on anti-trust concerns. At the same time, Bloomberg reported that JPM, C, and BAC are under investigation by the CFTC related to forcing would-be whistleblowers from speaking out by threatening civil penalties under company NDA policies. In unrelated news, the FTC approved a ban on common NDA agreements required by companies preventing employees from joining or launching firms the company deems to be competitors. (The rule will take effect in August and business groups have said they will sue to stop the rule.) Later, Reuters reported that the FAA has opened an investigation into BA for having retaliated against two employees who had insisted (in 2022) that the company re-evaluate prior engineering work on 777 and 787 jets. The investigation came after their union filed a complaint with the NRLB.

Overnight, Asian markets were nearly green across the board with the lone exception of Australia (-0.01%) which was barely in the red. The big bullish move was led by Taiwan (+2.72%), Japan (+2.42%), Hong Kong (+2.21%), and South Korea (+2.01%). Meanwhile, in Europe, markets are much more mixed at midday with six of 15 bourses in the red. Still, the CAC (+0.36%), DAX (+0.31%), and FTSE (+0.49%) lead the region higher in early afternoon trade. In the US, as of 7:30 a.m., Futures are pointing toward a mixed start to the day. DIA implies a -0.05% open, the SPY is implying a +0.16% open, and QQQ implies a +0.58% open at this hour. At the same time, 10-year bond yields are up to 4.644% and Oil (WTI) is down three-quarters of a percent to $82.75 per barrel in early trading.
The major economic news scheduled for Wednesday include March Core Durable Goods Orders and March Durable Goods Orders (both at 8:30 a.m.), and EIA Crude Oil Inventories (10:30 a.m.). The major earnings reports scheduled for before the open include APH, T, AVY, BIIB, BA, BSX, BG, CME, KOF, CSTM, ETR, FTV, GD, GPI, HAS, HLT, HUM, IPG, LII, LAD, MHO, MAS, COOP, EDU, NSC, ODFL, OTIS, OC, PRG, RCI, SABR, SYF, TEL, TDY, TMO, TNL, UMC, VRT, WAB, and WSO. Then, after the close, AGI, ALGN, AR, BMRN, CACI, CP, CLS, CCS, CHX, CHE, CMG, CHDN, CYH, EHC, F, GGG, ICLR, IBM, KALU, KNX, LRCX, LSTR, MTH, META, MEOH, MOH, NBR, ORLY, OII, PLXS, RJF, ROL, DEIC, NOW, TER, TX, TYL, URI, UHS, VALE, WCN, WU, WHR, and WM report.
In economic news later this week, Thursday, we get Weekly Initial Jobless Claims, Weekly Continuing Jobless Claims, Q1 GDP, Q1 GDP Price Index, March Goods Trade Balance, March Retail Inventories, March Pending Home Sales, and the Fed Balance Sheet. Finally, on Friday, March Core PCE Price Index, March PCE Price Index, March Personal Spending, Michigan Consumer Sentiment, Michigan Consumer Expectations, Michigan 1-Year Inflation Expectations, and Michigan 5-Year Inflation Expectations are reported.
In terms of earnings reports later this week, on Thursday, we hear from AOS, ADT, ALFVY, ALLE, MO, AAL, HOUS, AIT, ARCH, AMBP, ABG, AZN, BFH, BMY, BC, CARR, CAT, CBZ, CX, CHKP, CMS, CMCSA, CFR, DAR, DOV, DOW, DTE, EQNR, FCNCA, FCFS, FCN, GTX, GEV, HOG, HP, HTZ, HES, HON, IP, KDP, KEX, LH, LAZ, LECO, HZO, MRK, NDAQ, NEM, NOC, ORI, OSK, PCG, PHIN, POOL, RS, RCL, SPGI, SNY, SAH, LUV, SRCL, STM, FTI, TECK, TXT, TSCO, TRU, TPH, UNP, VLO, VC, GWW, WST, WEX, WTW, XEL, AEM, AB, ALSN, GOOGL, ATR, AJG, TEAM, AVB, BYD, COF, CSL, CINF, COLM, DXCM, EMN, EW, EGO, ERIE, FE, GILD, GOOG, TV, HIG, HUBG, INTC, JNPR, KLAC, LHX, MSFT, MTX, MHK, NOV, DOC, PFG, RMD, RHI, ROKU, SKX, SKYW, SNAP, SSNC, TMUS, TDOC, TS, TEX, TFII, TBBB, TPC, WDC, WY, and WKC. Finally, on Friday, ABBV, AON, ALV, AN, AVTR, BALL, CNC, CHTR, CVX, CL, XOM, FMX, GNTX, HCA, IMO, LYB, NWL, PSX, POR, ROP, SAIA, and TROW report.

So far this morning, AVY, BA, BXMT, BSX, CME, HAS, HELE, HLT, HUM, IPG, COOP, NKYDY, OC, RCI, TEL, TMO, TNL, VIRT, and WAB all reported beats on both the revenue and earnings lines. Meanwhile, T, BIIB, BG, LII, MAS, ODFL, OTIS, and VRT missed on the revenue line while beating on earnings. On the other side, CSTM, GD, GPI, EDU, SF, SYF, and WNC all beat on revenue while missing on earnings. Sadly, ETR, EVR, LAD, TDY, and UMC all missed on both the top and bottom lines. It is worth noting that BSX, EDU, and WAB raised their guidance. However, HELE and TEL lowered their forward guidance.
In miscellaneous news, on Tuesday, Reuters reported that State Dept. officials have said the Biden Administration are discussing sanctions on Chinese banks, but are not looking at imposing them in the near-term. However, the Wall Street Journal reported late Monday that sanctions were being drafted to stop Chinese banks from supporting Russia’s military production. Elsewhere, JPM CEO Dimon said Tuesday the economy “is booming” and the strength is “unbelievable.” He went on to say, “Even if we go into recession, the consumer’s still in good shape.” However, he also warned about the potential (longer-term) impacts of the national debt and (shorter-term) harms of inflation and geopolitical conflicts. Finally, in political news, the Senate passed the 4-bill package of foreign aid and TikTok forced sale or ban. The bill passed 79-18 and was forwarded to the President for signature.
With that background, it looks as if the market remains undecided so far this morning. The bulls opened the premarket higher in the QQQ and SPY but also slightly lower in the DIA. Since then, all three major index ETFs are giving us small and very wicky candles, showing uncertainty. The bias is on the Bulls’ side this morning, but just barely. All three are back above their T-line (8ema) showing that the Bulls have retaken the short-term trend. Meanwhile, the mid-term remains bearish but is under pressure. The longer-term market remains Bullish but trend has been broken and is clearly under pressure. In terms of extension, none of the major index ETFs is too far extended from their T-line and the T2122 indicator remains in its mid-range. So, both sides have plenty of room to run if they can gain the momentum to do so. In terms of those 10 big dog tickers, seven of the 10 are in the green with only AAPL, GOOGL, and NFLX in the red this morning. The oddity is TSLA, which is up more than 12% on a huge miss…but as the huckster is wont to do, Musk promised new models early next year (things are always just around the corner with him) that are going to make TSLA cars more affordable and revolutionize the EV market. (The same was said last year about this year.) With that all said, be careful. We’ve see a lot of those widowmaker whipsaws lately.
As always, be deliberate and disciplined…but don’t be stubborn. If you have a loss, admit you were wrong and take that loss before it gets out of hand. And when the price does move in your direction, always move your stops in your favor and take a little profit off the table. You have to keep the “Legend of the Man in the Green Bathrobe” in mind. In a winning situation, it is NOT HOUSE MONEY you’re betting, it’s YOUR MONEY! There is no reason to keep raising your bet (risk) size just because you’ve had a win. Finally, remember that trading is not a hobby, it’s a job. The gains are real and so is the risk. So, treat it that way. Do the work and follow the process. Stick to your trading rules, trade with the trend, and take those profits when you have them. Do the work!
See you in the trading room.
Ed


🎯 Mike Probst: Rick, Got CTL off the scanner today. Already up 30%. Love it.
🎯 Dick Carp: the scanner paid for the year with HES-thank you
🎯 Arnoldo Bolanos: LTA scanner really works $$, thanks Ed.
🎯 Bob S: LTA is incredible…. I use it … would not trade without it
🎯 Malcolm .: Posted in room 2, @Rick… I used the LTA Scanner to go through hundreds of stocks this weekend and picked out three to trade: PYPL, TGT, and ZS. Quality patterns and with my trading, up 24%, 7% and 12%…. this program is gold.
🎯 Friday 6/21/19 (10:09 am) Aaron B: Today, my account is at +190% since January. Thanks, RWO HRC Flash Malcolm Thomas Steve Ed Bob S Bob C Mike P and everyone that contributes every day. I love our job.
Hit and Run Candlesticks / Road To Wealth Youtube videos
Disclosure: We do not act on all trades we mention, and not all mentions acted on the day of the mention. All trades we mention are for your consideration only.


Free YouTube Education • Subscription Plans • Private 2-Hour Coaching
DISCLAIMER: Investing / Trading involves significant financial risk and is not suitable for everyone. No communication from Hit and Run Candlesticks Inc, its affiliates or representatives is not financial or trading advice. All information provided by Hit and Run Candlesticks Inc, its affiliates and representatives are intended for educational purposes only. You are advised to test any new trading approach before implementing it. Past performance does not guarantee future results. Terms of Service
Public e-Learning 4-16-24 – Doug
GM and PEP Both Beat and Raise
Markets were indecisively bullish on Monday. The SPY gapped up 0.56%, DIA gapped up 0.50%, and QQQ gapped up 0.68%. At that point, all three major index ETFs faded the gap, reaching the lows of the day at 11:20 a.m. From there, all three rallied strongly and steadily to the highs at 2:30 p.m. However, the SPY, DIA, and QQQ then all sold off the last 90 minutes of the day. This whipsaw action gave us gap-up, white-bodied, Spinning Top candles in all three. SPY and QQQ printed Bullish Harami Cross candles while DIA printed a Spinning Top that gapped up through, retested and stayed above its T-line (8ema). This all happened on below average volume in all three major index ETFs.
On the day, nine of the 10 sectors were in the green with Financial Services (1.35%) and Technology (+1.21%) out in front leading the market higher while Basic Materials (-0.13%) was by far the worst performing sector. At the same time, SPY gained 0.92%, DIA gained 0.68%, and QQQ gained 1.01%. VXX plummeted 7.70% to close at 14.27 and T2122 jumped back up to the center of its mid-range at 53.77. 10-year bond yields fell to 4.611% and Oil (WTI) was just on the red side of flat at $83.02 per barrel. So, Monday was a bullish, but indecisive and very volatile day. We saw a gap higher two different down waves of more than half a percent and a 1.4% up wave in the middle. Not a market for the faint-hearted
There was no major economic news scheduled for Monday.
After the close, AGNC, AMP, BRO, CADE, CR, and PKG reported beats on both the revenue and earnings lines. Meanwhile, ARE, CDNS, HXL, and MEDP missed on revenue while beating on earnings. On the other side, SAP and SSD beat on revenue while missing on earnings. Unfortunately, CLF, GL, LU, and NUE missed on both the top and bottom lines. It is worth noting, MEDP raised their guidance. However, NUE and PKG both lowered forward guidance.
In stock news, on Monday, auto supplier ADNT announced its restructuring its Europe business unit and will lay off an unspecified number of workers. (42% of ADNT’s 70k workers are located in Europe.) At the same time, UAE-based G42 (an AI firm) said it had agreed to a partnership with QCOM related to QCOM’s cloud AI products. Later, CAH announced that it had lost contracts from UNH (one of CAH’s largest customers, contributing 16% of revenue in 2023) as the deal will not be renewed at the end of June. (Industry analysts expect MCK to gain the contracts.) At the same time, the New York Times reported AAPL is very close to finalizing a worldwide TV rights deal for FIFA’s month-long club tournament. Later, Reuters reported that an internal memo from BA said the company expects a slower increase in the production and delivery rates for 787 jets. The memo cited parts shortages from “a few key suppliers.”
In stock legal and governmental news, on Monday EXPR filed bankruptcy (Chapter 11) protection and said it will close more than 100 stores. Later, the US Supreme Court rejected an appeal from VNDA, which had hoped to revive patents that had been declared invalid by a lower court in the company’s legal dispute with TEVA. At the same time, the FAA announced it is finalizing rules to require commuter, charter, tour, and aircraft manufacturers to implement a set of safety policies and procedures (akin to a quality management system). Up to this point, those types of commercial aircraft operators were not required to do so the way major airlines were. Later, the FTC said it would be filing suit to clock the TPR $8.5 billion acquisition of CPRI. The agency said the merging of ownership of the two company’s various luxury brands would reduce competition significantly in that industry. At the same time, KR and ACI said they would be selling off 166 more grocery stores than previously announced as the companies work to get regulatory approval for the $15 billion “merger.”
Overnight, Asian markets were mixed but leaned toward the green side again. Hong Kong (+1.92%), Singapore (+1.47%), and Taiwan (+0.97%) led the region higher. In Europe, with the sole exception of Russia (-0.40%) we see green across the board at midday. The DAX (+1.12%), CAC (+0.67%), and FTSE (+0.43%) lead the region higher in early afternoon trade. In the US, as of 7:30 a.m., Futures are pointing toward another green start to the day. The DIA implies a +0.22% open, the SPY is implying a +0.29% open, and the QQQ implies a +0.33% open at this hour. At the same time, 10-year bond yields are up to 4.637% and Oil (WTI) is down 0.53% to $81.47 per barrel in early trading.
The major economic news scheduled for Tuesday includes Building Permits (8 a.m.), S&P Global Mfg. PMI, S&P Global Services PMI, and S&P Global Composite PMI (all at 9:45 a.m.), March New Home Sales (10 a.m.), and API Weekly Crude Oil Stocks (4:30 p.m.). The major earnings reports scheduled for before the open include DHR, FI, FCX, GE, GM, HAL, HRI, IVZ, JBLU, KMB, LKQ, LMT, MSCI, NEE, NVS, OPCH, PNR, PEP, PII, BPOP, PHM, DGX, RTX, R, SHW, SPOT, UPS, WRB, WBS, and XRX. Then, after the close AGR, BKR, CNI, CB, CSGP, EWBC, ENVA, EQT, EQR, HA, IEX, MTDR, MAT, RRC, STX, STLD, LRN, TSLA, TXN, VLTO, V, WFRD, and WFG report.
In economic news later this week, Wednesday, March Core Durable Goods, March Durable Goods, and EIA Crude Oil Inventories are reported. On Thursday, we get Weekly Initial Jobless Claims, Weekly Continuing Jobless Claims, Q1 GDP, Q1 GDP Price Index, March Goods Trade Balance, March Retail Inventories, March Pending Home Sales, and the Fed Balance Sheet. Finally, on Friday, March Core PCE Price Index, March PCE Price Index, March Personal Spending, Michigan Consumer Sentiment, Michigan Consumer Expectations, Michigan 1-Year Inflation Expectations, and Michigan 5-Year Inflation Expectations are reported.
In terms of earnings reports later this week, on Wednesday APH, T, AVY, BIIB, BA, BSX, BG, CME, KOF, CSTM, ETR, FTV, GD, GPI, HAS, HLT, HUM, IPG, LII, LAD, MHO, MAS, COOP, EDU, NSC, ODFL, OTIS, OC, PRG, RCI, SABR, SYF, TEL, TDY, TMO, TNL, UMC, VRT, WAB, WSO, AGI, ALGN, AR, BMRN, CACI, CP, CLS, CCS, CHX, CHE, CMG, CHDN, CYH, EHC, F, GGG, ICLR, IBM, KALU, KNX, LRCX, LSTR, MTH, META, MEOH, MOH, NBR, ORLY, OII, PLXS, RJF, ROL, DEIC, NOW, TER, TX, TYL, URI, UHS, VALE, WCN, WU, WHR, and WM report. On Thursday, we hear from AOS, ADT, ALFVY, ALLE, MO, AAL, HOUS, AIT, ARCH, AMBP, ABG, AZN, BFH, BMY, BC, CARR, CAT, CBZ, CX, CHKP, CMS, CMCSA, CFR, DAR, DOV, DOW, DTE, EQNR, FCNCA, FCFS, FCN, GTX, GEV, HOG, HP, HTZ, HES, HON, IP, KDP, KEX, LH, LAZ, LECO, HZO, MRK, NDAQ, NEM, NOC, ORI, OSK, PCG, PHIN, POOL, RS, RCL, SPGI, SNY, SAH, LUV, SRCL, STM, FTI, TECK, TXT, TSCO, TRU, TPH, UNP, VLO, VC, GWW, WST, WEX, WTW, XEL, AEM, AB, ALSN, GOOGL, ATR, AJG, TEAM, AVB, BYD, COF, CSL, CINF, COLM, DXCM, EMN, EW, EGO, ERIE, FE, GILD, GOOG, TV, HIG, HUBG, INTC, JNPR, KLAC, LHX, MSFT, MTX, MHK, NOV, DOC, PFG, RMD, RHI, ROKU, SKX, SKYW, SNAP, SSNC, TMUS, TDOC, TS, TEX, TFII, TBBB, TPC, WDC, WY, and WKC. Finally, on Friday, ABBV, AON, ALV, AN, AVTR, BALL, CNC, CHTR, CVX, CL, XOM, FMX, GNTX, HCA, IMO, LYB, NWL, PSX, POR, ROP, SAIA, and TROW report.
So far this morning, DHR, FI, GE, GM, HAL, KMB, LMT, NEE, NVS, OPCH, PNR, PEP, PHM, DGX, RTX, R, and SPOT have all posted beats on both the revenue and earnings lines. Meanwhile, BANC, HRI, IVZ, NJDCY, and WBS all reported beat on revenue while missing on earnings. On the other side, JBLU, MSCI, PM, PII, and UPS all missed on revenue while beating on earnings. Unfortunately, LKQ, SHW, and XRX missed on both the top and bottom lines. It is worth noting that JBLU has lowered its forward guidance. However, GM has raised guidance after a blowout quarter.
In miscellaneous news, on Monday, the Communist Party Central Economic Planner said the global EV price war will continue the rest of 2024. The economist said he expects 2.1 million EVs to be sold this year. However, the three main Chinese EV brands plan to produce 2.3 million themselves. This does not count TSLA or any other non-Chinese manufacturers. Later, the Equipment Leasing and Finance Assn. (ELFA) said that US companies borrowed 7% less in March 2024 than they had one year prior. However, March was also up 18% over February of this year.
With that background, it looks as if the bulls are making another indecisive move higher in the premarket. All three major index ETFs gapped higher to start the early session. However, since that point, all three have also given us more wick than (still white) body in the premarket. DIA remains back above its T-line (8ema). However, the SPY and QQQ remain below their T-line. So the short-term trend remains bearish to mixed. Meanwhile, the mid-term has also turned bearish and the longer-term market remains Bullish but trend is broken and is clearly under pressure. In terms of extension, none of the major index ETFs is too far extended from their T-line and the T2122 indicator is now back in its mid-range. So, both sides have plenty of room to run if they can gain the momentum to do so. In terms of those 10 big dog tickers, eight of the 10 are in the green with only AAPL and INTC barely in the red this morning. With that all said, be careful. This week is packed with economic data (PCE) and a ton of earnings. Plus we’ve see a lot of those widowmaker whipsaws lately.
As always, be deliberate and disciplined…but don’t be stubborn. If you have a loss, admit you were wrong and take that loss before it gets out of hand. And when the price does move in your direction, always move your stops in your favor and take a little profit off the table. You have to keep the “Legend of the Man in the Green Bathrobe” in mind. In a winning situation, it is NOT HOUSE MONEY you’re betting, it’s YOUR MONEY! There is no reason to keep raising your bet (risk) size just because you’ve had a win. Finally, remember that trading is not a hobby, it’s a job. The gains are real and so is the risk. So, treat it that way. Do the work and follow the process. Stick to your trading rules, trade with the trend, and take those profits when you have them. Do the work!
See you in the trading room.
Ed
🎯 Mike Probst: Rick, Got CTL off the scanner today. Already up 30%. Love it.
🎯 Dick Carp: the scanner paid for the year with HES-thank you
🎯 Arnoldo Bolanos: LTA scanner really works $$, thanks Ed.
🎯 Bob S: LTA is incredible…. I use it … would not trade without it
🎯 Malcolm .: Posted in room 2, @Rick… I used the LTA Scanner to go through hundreds of stocks this weekend and picked out three to trade: PYPL, TGT, and ZS. Quality patterns and with my trading, up 24%, 7% and 12%…. this program is gold.
🎯 Friday 6/21/19 (10:09 am) Aaron B: Today, my account is at +190% since January. Thanks, RWO HRC Flash Malcolm Thomas Steve Ed Bob S Bob C Mike P and everyone that contributes every day. I love our job.
Hit and Run Candlesticks / Road To Wealth Youtube videos
Disclosure: We do not act on all trades we mention, and not all mentions acted on the day of the mention. All trades we mention are for your consideration only.
Free YouTube Education • Subscription Plans • Private 2-Hour Coaching
DISCLAIMER: Investing / Trading involves significant financial risk and is not suitable for everyone. No communication from Hit and Run Candlesticks Inc, its affiliates or representatives is not financial or trading advice. All information provided by Hit and Run Candlesticks Inc, its affiliates and representatives are intended for educational purposes only. You are advised to test any new trading approach before implementing it. Past performance does not guarantee future results. Terms of Service
Crossroads
Today investors find themselves at a crossroads of anticipation and caution. The market has witnessed a rebound, with Big Tech companies poised to release their earnings, sparking a collective breath of optimism. This week is particularly crucial as it sees the convergence of financial disclosures from approximately 30% of the S&P 500 entities, setting the stage for potential market reassurance.
However, the recent past has painted a more sobering picture. Wall Street experienced a sharp decline, marking its worst performance since October, as the S&P 500 fell by 1.5%. This downturn was part of a broader trend, with the S&P 500 extending its losing streak influenced by slumps in major tech firms like Nvidia and Netflix.
Economic Calendar

Earnings Calendar

Notable reports for Tuesday. Before the bell, BANC, DHR, EWBC, FBP. FCF. FI. FCX. GATX. GE. GM, HAL, IVZ, JBLUE, KMB, LMT, MSCI, NEE, NEP, PNR, PEP, PM, PII, PHM, DGX, RTX, R, SHW, SPOT, UPS, WRB, WBS, & XRX. After the bell reports includeTSLA, BKR, CNI, CB, CGSP, ENPH, EQT, EQR, HA, IEX, MTDR, MAT, RRC, STX, STLD, LRN, TXN, TRMK, VBTX, VICR, V, WSBC, & ZWS.
News & Technicals’

The upcoming days are set to be a defining moment for the U.S. technology sector as industry giants such as Tesla, Meta, Microsoft, and Google’s parent company Alphabet are on the cusp of revealing their latest financial figures. The earnings week is set to ignite with Tesla, the electric vehicle pioneer led by Elon Musk, announcing its results after Tuesday’s market close. This series of disclosures follows a tumultuous period for the tech market, evidenced by a 5.5% drop in the Nasdaq Composite last week. The sentiment in the market is one of cautious scrutiny, as noted by Nicolai Tangen, CEO of Norges Bank Investment Management, who highlighted the presence of speculative “froth” in the tech sector during his interview with CNBC. The true measure of this speculation, however, remains to be seen, casting a veil of uncertainty over the impending earnings announcements.
The dichotomy between hope and reality is further accentuated by the mixed results of the current reporting period. While a majority of companies have exceeded expectations, the overall growth for Q1 remains tepid, with FactSet data indicating a flat year-on-year trajector. This stands in stark contrast to the more than 3% growth that analysts had projected at the onset of the earnings season.

As investors navigate this complex environment, they remain vigilant, weighing the potential impact of upcoming earnings reports against the backdrop of recent market volatility. The question on everyone’s mind is whether the forthcoming financial revelations will serve as a catalyst for recovery or contribute to ongoing market trepidation.
Today’s stock market is an interplay of various economic forces with trader at the corssroads of hope and uncertainty. From the anticipation surrounding Big Tech earnings to the cautious reflection on recent downturns, investors are reminded of the inherent uncertainties that define the financial world. As we look ahead, it is clear that the market’s trajectory will be shaped by a multitude of factors, likely to create considerable emotion and price volitility.
Trade Wisely,
Doug

Member e-Learning 4-18-24 – Doug
Bulls Stretch Legs to Start Big Earnings Week
Friday saw markets open modestly. SPY opened flat a -0.01%, DIA opened +0.22%, and QQQ gapped down 0.25%. From there, SPY and QQQ sold off in a wavy manner the rest of the day. At the same time, DIA meandered sideways above the open all day. This action gave us large black-body candles with small wicks on both ends for the SPY and QQQ. Meanwhile, the DIA printed a white-bodied Spinning Top candle that retested but failed it s T-line (8ema). This happened on well above-average volume in all three major index ETFs.
On the day, eight of the 10 sectors were in the green with Utilities (1.51%) leading the market higher while Technology (-2.21%) was war and away (by 1.6% more than the other red sector) the biggest loser. The big drag on technology was SMCI (-23.14%) which announced its earnings date, but did not include a prerelease of preliminary results as has been their custom. This led to panic that the SMCI and the broader tech industry is in trouble. The worst part for the market was that this spread to NVDA (-10.00%) which is by far the biggest market-mover, normally trading 2-3 times as much dollar volume as the next closes ticker. However, Friday, NVDA traded five times as much dollar-volume than the next closes ticker.
This led to the SPY losing 0.87%, DIA gaining 0.52%, and QQQ losing a whopping 2.07%. VXX gained 3.27% to close at 15.46 and T2122 climbed but remains just inside of its oversold territory at 19.15. 10-year bond yields fell a bit to 4.623% and Oil (WTI) was higher by 0.54% at $83.14 per barrel. So, Friday was a story of fear. SMCI made the market fear that the AI craze was ending leaving nothing but an abyss for the broader tech sector (which has driven markets for years now). In addition to the two already mentioned, NFLX (-9.09%), AMD (-5.44%), and META (-4.13%) were also hammered and led the way lower.
There was no major economic news scheduled for Friday.
In FOMC speak, Chicago Fed President Goolsbee said that progress on inflation has been stalled this year. Gone are his mentions of being on a “golden path.” For now, he is counseling that the Fed stand pat, saying, “Given the strength of the labor market and progress on easing inflation seen over a longer arc, I believe the Fed’s current restrictive monetary policy is appropriate,” … “I think we have to recalibrate and we have to wait and see.” He continued, “We’re just trying to figure out what is necessary, how restrictive do we need to be” … “We have weeks, months to find out.” Finally, and as always, he said “Ultimately the proper policy going forward will depend on the data.”
In stock news, on Friday, Invetstin.com reported that the sale of PARA to Skydance Media may fall through as a competing big of $29 billion is in the works from the joint efforts of SONY and APO. This news comes as the clock ticks on a 30-day exclusive negotiating rights period ticks away from Skydance. Later, GOOGL announce they are rolling back requirements that suppliers and staffing firms pay their employees at least $15/hour and provide health benefits. The move is designed to help suppliers avoid bargaining with unions. At the same time, Reuters reported that an internal memo shows that NKE will lay off 740 employees at its headquarters. Later, LULU announced it will close id WA state distribution center and lay off 128 employees. Meanwhile, TSLA announced it is cutting prices on Y, X, and S models by $2,000 and will end its customer referral benefits program on April 30.
Elsewhere, the UAW won the employee vote at the VLKAF (Volkswagen) TN plant in a landslide vote with 73% for joining the union. This was a big deal in that it is the first automaker plant in the South to unionize. Later, a Swiss newspaper reported that the first of five planned waves of layoffs at UBS will begin in June. This comes after the absorbing of CS and will be a cost-cutting and duplication reduction program. The report expects 50%-60% of former CS staff to be laid off in one of the five waves. On Saturday, TSLA cut the price of its “Full Self Driving” feature from $12k to $8k. Then on Sunday, TSLA cut the price of some models in Europe, Africa, and the Middle East.
In stock legal and governmental news, on Friday, the FAA issued new rules that will require air traffic controllers to have at least 10 hours between shifts and 12 hours off prior to a midnight shift. The new rules take effect in 90 days. At the same time, SWBI and RGR appealed to the US Supreme Court to hear their appeal of a $10 billion suit brought by Mexico. The Mexico suit alleges the gun makers are responsible for misuse of their products in that country among others by drug cartels. The appeal comes after the 1st Circuit Court of Appeals ruled in favor of Mexico, overturning the district court. Later, the NHTSA announced that STLA is recalling 38k 2023-2024 vehicles over a steering column issue that may prevent the driver’s airbag from deploying. At the same time, the World Health Org. issued a broader warning over contaminated JNJ children’s cough syrup (now owned by KVUE). The original problem was found in Nigeria, but cases have now been found around Africa, Asia, and Eurasia. Later, the Wall Street Journal reported that China has ordered AAPL to remove META WhatsApp and Threads along with other messaging apps from their app store. At the same time, the US Dept. of Energy announced that ALB, CMI, SMNEY (Siemens), BLBP, and MP will receive a total of $1.93 billion in tax credits related to 35 clean energy projects.
Elsewhere, the NHTSA announced that TLSA will recall 3,900 Cybertrucks to fix an accelerator pedal that can come loose and get lodged in the trim causing unintentional acceleration. At the same time, the US Interior Dept. announced it will limit oil and gas drilling as well as mining on public lands in Alaska. Oil companies and AK politicians decried the decision as hurting jobs and the economic growth. Later, WFC was hit with a sex discrimination lawsuit from one of their bond saleswomen. The suit alleges the company operates an “unapologetically sexist” workplace where male managers routinely having sexual relations with subordinate women, men often make degrading jokes, and accounts are handled through an “old boy network” which cost the plaintiff millions in commissions and forced her to wait nine years for promotion to director (from Vice President).
Overnight, Asian markets were mostly green with just three of the 12 exchanges in the red. Hong Kong (+1.77%), Singapore (+1.53%), and South Korea (+1.45%) led the region higher but the gains were broad with half of the region’s exchanges up more than one percent. In Europe, we see a similar picture at midday with 13 of 15 bourses in the green. The FTSE (+1.59%), CAC (+0.18%), and DAX (+0.48%) lead the region on volume in early afternoon trade. In the US, as of 7:30 a.m., Futures are pointing toward a gap higher to start the day. The DIA implies a +0.52% open, the SPY is implying a +0.56% open, and the QQQ implies a +0.63% open at this hour. At the same time, 10-year bond yields are up to 4.66% and Oil (WTI) is flat at $83.15 per barrel in early trading.
There is no major economic news scheduled for Monday. However, the major earnings reports scheduled for before the open include ACI, KSPI, SDVKY, TFC, VZ, and ZION. Then, after the close, ARE, AMP, BRO, CDNS, CLF, CR, GL, HXL, LU, MEDP, NUE, PKG, SAP, and VLRS report.
In economic news later this week, Tuesday we get Building Permits, S&P Global Mfg. PMI, S&P Global Services PMI, S&P Global Composite PMI, March New Home Sales, and API Weekly Crude Oil Stocks. Then Wednesday, March Core Durable Goods, March Durable Goods, and EIA Crude Oil Inventories are reported. On Thursday, we get Weekly Initial Jobless Claims, Weekly Continuing Jobless Claims, Q1 GDP, Q1 GDP Price Index, March Goods Trade Balance, March Retail Inventories, March Pending Home Sales, and the Fed Balance Sheet. Finally, on Friday, March Core PCE Price Index, March PCE Price Index, March Personal Spending, Michigan Consumer Sentiment, Michigan Consumer Expectations, Michigan 1-Year Inflation Expectations, and Michigan 5-Year Inflation Expectations are reported.
In terms of earnings reports later this week, on Tuesday, we hear from DHR, FI, FCX, GE, GM, HAL, HRI, IVZ, JBLU, KMB, LKQ, LMT, MSCI, NEE, NVS, OPCH, PNR, PEP, PII, BPOP, PHM, DGX, RTX, R, SHW, SPOT, UPS, WRB, WBS, XRX, AGR, BKR, CNI, CB, CSGP, EWBC, ENVA, EQT, EQR, HA, IEX, MTDR, MAT, RRC, STX, STLD, LRN, TSLA, TXN, VLTO, V, WFRD, and WFG. Then Wednesday APH, T, AVY, BIIB, BA, BSX, BG, CME, KOF, CSTM, ETR, FTV, GD, GPI, HAS, HLT, HUM, IPG, LII, LAD, MHO, MAS, COOP, EDU, NSC, ODFL, OTIS, OC, PRG, RCI, SABR, SYF, TEL, TDY, TMO, TNL, UMC, VRT, WAB, WSO, AGI, ALGN, AR, BMRN, CACI, CP, CLS, CCS, CHX, CHE, CMG, CHDN, CYH, EHC, F, GGG, ICLR, IBM, KALU, KNX, LRCX, LSTR, MTH, META, MEOH, MOH, NBR, ORLY, OII, PLXS, RJF, ROL, DEIC, NOW, TER, TX, TYL, URI, UHS, VALE, WCN, WU, WHR, and WM report. On Thursday, we hear from AOS, ADT, ALFVY, ALLE, MO, AAL, HOUS, AIT, ARCH, AMBP, ABG, AZN, BFH, BMY, BC, CARR, CAT, CBZ, CX, CHKP, CMS, CMCSA, CFR, DAR, DOV, DOW, DTE, EQNR, FCNCA, FCFS, FCN, GTX, GEV, HOG, HP, HTZ, HES, HON, IP, KDP, KEX, LH, LAZ, LECO, HZO, MRK, NDAQ, NEM, NOC, ORI, OSK, PCG, PHIN, POOL, RS, RCL, SPGI, SNY, SAH, LUV, SRCL, STM, FTI, TECK, TXT, TSCO, TRU, TPH, UNP, VLO, VC, GWW, WST, WEX, WTW, XEL, AEM, AB, ALSN, GOOGL, ATR, AJG, TEAM, AVB, BYD, COF, CSL, CINF, COLM, DXCM, EMN, EW, EGO, ERIE, FE, GILD, GOOG, TV, HIG, HUBG, INTC, JNPR, KLAC, LHX, MSFT, MTX, MHK, NOV, DOC, PFG, RMD, RHI, ROKU, SKX, SKYW, SNAP, SSNC, TMUS, TDOC, TS, TEX, TFII, TBBB, TPC, WDC, WY, and WKC. Finally, on Friday, ABBV, AON, ALV, AN, AVTR, BALL, CNC, CHTR, CVX, CL, XOM, FMX, GNTX, HCA, IMO, LYB, NWL, PSX, POR, ROP, SAIA, and TROW report.
So far this morning, TFC reported beats on both the revenue and earnings lines. At the same time, VZ missed on revenue while beating on earnings.
In miscellaneous news, on Friday, the USDA confirmed that bird flu can be transmitted between cattle. This just adds another vector to be accounted for in attempting to control the virus. However, as of now, pasteurization still kills the virus, leaving the cattle’s milk still viable for humans and the bird flu is not deadly to cattle. Elsewhere, Bitcoin finished its fourth “halving” on Friday. This means that Bitcoin miners only get half as much Bitcoin in return for the same mining effort. (These “halvings” happen every four years and are designed to make existing Bitcoin even more valuable. In other news, China slapped an 43.5% anti-dumping tariff on an acid from the US, which is widely used in food, feed, pesticides, and medical fields. The move comes as trade tensions between Beijing and Washington increase.
With that background, it looks as if the bulls want to make a run this morning. All three major index ETFs gapped up to start the premarket and have put in strong white-bodied candles with no wicks since then. DIA has even crossed back above its T-line (8ema). However, the SPY and QQQ remain well below their T-line. So the short-term trend remains bearish to mixed. Meanwhile, the mid-term has also turned bearish and the longer-term market remains Bullish but trend is broken and is clearly under pressure. In terms of extension, the QQQ is extended below their T-line but the DIA is fine and SPY is somewhere between those two. Still, the T2122 indicator remains just inside its oversold range. So, again, a rest would seem in order at the very least for the Bears. (Just remember markets can remain oversold a lot longer than we can stay solvent predicting a reversal.) In terms of those 10 big dog tickers, eight of the 10 are in the green with the huge dog NVDA (+1.80%) looking to rebound after the weekend to reconsider the “sky is falling” Friday panic. TSLA (-3.82%) is down hard again as it is hit from its weekend price cuts and other news. With that all said, be careful. This week is packed with economic data (PCE) and a ton of earnings.
As always, be deliberate and disciplined…but don’t be stubborn. If you have a loss, admit you were wrong and take that loss before it gets out of hand. And when the price does move in your direction, always move your stops in your favor and take a little profit off the table. You have to keep the “Legend of the Man in the Green Bathrobe” in mind. In a winning situation, it is NOT HOUSE MONEY you’re betting, it’s YOUR MONEY! There is no reason to keep raising your bet (risk) size just because you’ve had a win. Finally, remember that trading is not a hobby, it’s a job. The gains are real and so is the risk. So, treat it that way. Do the work and follow the process. Stick to your trading rules, trade with the trend, and take those profits when you have them. Do the work!
See you in the trading room.
Ed
🎯 Mike Probst: Rick, Got CTL off the scanner today. Already up 30%. Love it.
🎯 Dick Carp: the scanner paid for the year with HES-thank you
🎯 Arnoldo Bolanos: LTA scanner really works $$, thanks Ed.
🎯 Bob S: LTA is incredible…. I use it … would not trade without it
🎯 Malcolm .: Posted in room 2, @Rick… I used the LTA Scanner to go through hundreds of stocks this weekend and picked out three to trade: PYPL, TGT, and ZS. Quality patterns and with my trading, up 24%, 7% and 12%…. this program is gold.
🎯 Friday 6/21/19 (10:09 am) Aaron B: Today, my account is at +190% since January. Thanks, RWO HRC Flash Malcolm Thomas Steve Ed Bob S Bob C Mike P and everyone that contributes every day. I love our job.
Hit and Run Candlesticks / Road To Wealth Youtube videos
Disclosure: We do not act on all trades we mention, and not all mentions acted on the day of the mention. All trades we mention are for your consideration only.
Free YouTube Education • Subscription Plans • Private 2-Hour Coaching
DISCLAIMER: Investing / Trading involves significant financial risk and is not suitable for everyone. No communication from Hit and Run Candlesticks Inc, its affiliates or representatives is not financial or trading advice. All information provided by Hit and Run Candlesticks Inc, its affiliates and representatives are intended for educational purposes only. You are advised to test any new trading approach before implementing it. Past performance does not guarantee future results. Terms of Service
A Wild Week Ahead
We start the week off with a little break in the middle easte goeplitical tensisons easing oil prices and setting up a morning gap. However, espect this week to be very volitile as earnigns reports ramp up to include some of the tech titians. At the end of the week we will get a GDP and a Core PCE inflation report likely to create some uncertainty as we wait. Bond yeilds this morning are already higher this morning in anticipation so watch carefully for the possible opening gap whipsaw we experienced every day last week.
Economic Calendar

Earnings Calendar
Notable reports for Monday. Before Bell ACI, AZZ, BOH, TFC, VZ, & ZION. After The Bell, AGNC, ARE, BRO, CADE, CDNS, CALX, CLF, CR, ELX, GL, HSTM, HXL, IBTX, MEDP, NUE, PKG, PNFP, SAP, & SSD..
News & Technicals’
Tesla, the electric vehicle (EV) manufacturer spearheaded by CEO Elon Musk, has implemented significant price reductions across several key markets, including China and Germany. This strategic move follows similar price cuts in the United States and comes amidst a backdrop of declining sales figures and escalating competition within the EV sector, particularly from Chinese manufacturers. The decision to lower prices marks a notable shift for Tesla, which reported a decrease in global vehicle deliveries for the first quarter, an occurrence not seen in almost four years, signaling a potential recalibration of its market approach in response to the intensifying industry dynamics.
In a significant development, Ukraine was granted a crucial respite over the weekend when the U.S. House of Representatives, after prolonged deliberations, endorsed a substantial $61 billion foreign aid package. The passage of this bill marks a pivotal moment, as it now advances to the Senate, where it is anticipated to receive the green light from the Democratic majority. The approval by the Senate is expected imminently, within the week, setting the stage for President Joe Biden’s final ratification. This legislative action is not just a procedural triumph but a lifeline for Ukraine, which urgently requires enhanced air defense systems, artillery, and ammunition. These resources are deemed essential for Ukraine to potentially shift the dynamics of the ongoing conflict.
Despite Huawei’s recent advancements in semiconductor technology, China still lags significantly behind the United States in this critical field, as stated by Secretary Raimondo. The gap underscores the complex landscape of global tech leadership, where breakthroughs are measured not just in isolated achievements but in sustained, cutting-edge innovation. The Biden administration asserts that its policies on chip exports are proving effective, reflecting a strategic approach to maintain the U.S.’s competitive edge and safeguard national security interests. As the semiconductor industry becomes increasingly intertwined with geopolitical concerns, the U.S. is poised to continue its vigilant stance on the export of these pivotal technologies.
The upcoming week heralds a pivotal juncture in the financial calendar, with a host of the globe’s most colossal corporations poised to unveil their earnings. An estimated 30% of the S&P 500 firms are on the docket to disclose their financial health. The current earnings season has presented a dichotomy of outcomes. On one hand, an impressive over 73% of reporting entities have surpassed analysts’ projections. On the other, the aggregate growth for Q1 appears to be treading water, with projections indicating a stagnant year-over-year growth, contrary to the anticipated 3% increase pre-season, as per FactSet’s insights. This mixed bag of financial revelations underscores the unpredictable nature of market performance amidst a fluctuating economic landscape. Expect a very volitle week of price action and watch for big point whipsaws particularly after the morning gaps.
Trade Wisely,
Doug
Member e-Learning 4-18-24 – John
Israel Strikes and Speaker Drama Over Aid
Thursday saw markets start out bullish. The SPY gapped up 0.30%, DIA gapped up 0.43%, and QQQ opened 0.15% higher. After 10-15 minutes of gathering themselves, all three major index ETFs rallied to the highs of the day at 11:25 a.m. However, then momentum reversed, and all three sold off steadily, reaching the lows of the day about 1:25 p.m. At that point, QQQ ground sideways in a tight range, near the lows, the rest of the day. Meanwhile, the large-cap index ETFs both rallied slightly the 90 minutes of the day. This action gave us black-bodied candles in all three major index ETFs. The SPY and DIA both printed a black Spinning Top that consolidated in the DIA. DIA also retested and failed its T-line (8ema) while SPY came nowhere near retesting and remains well below its T-line. At the same time, QQQ had a larger black body and continued its move down, also not retesting its T-line.
On the day, six of the 10 sectors were in the red with Technology (-0.65%) out in front leading the way lower. Meanwhile, Communications Services (+0.70%) led the four green sectors higher. At the same time, SPY lost 0.19%, DIA gained 0.11%, and QQQ lost 0.57%. VXX gained slightly to close at 14.97 and T2122 rose but remains deeply in the oversold territory at 4.03. 10-year bond yields popped up to 4.633% and Oil (WTI) was flat at $82.69 per barrel. So, overall, Thursday seemed like consolidation day in the large-cap index ETFs (especially the DIA) while QQQ continued South. NVDA (+0.76%) largely held the tech sector up itself with $35 billion in tis stock traded while TSLA (-3.57%) led most of the sector lower on $12.8 billion (2nd largest dollar amount traded). This all happened on less than average volume in the SPY and QQQ and a bit more than average volume in the DIA.
The major economic news scheduled for Thursday included Weekly Initial Jobless Claims, which came in a touch lower than expected at 212k (compared to a forecast of 215k but in-line with the prior week’s 212k). On the ongoing side, Weekly Continuing Jobless Claims, were also just a bit lower than predicted at 1,812k (versus a forecast of 1,818k but also up slightly from the previous week’s 1,810k). At the same time, the Philly Fed Mfg. Index was stronger than anticipated, but still low, 15.5 (compared to a forecasted 1.5 and the March reading of 3.2). However, Philly Fed Mfg. Employment Index was down at -10.7 (versus the March -9.6 value). Later, March Existing Home Sales fell to 4.19 million (compared to 4.20 million forecast but down from the February 4.38 million). This was a 4.3% decrease month-on-month in March. At the same time, the US Leading Economic Indicator Index was weaker than expected at -0.3% (versus a -0.1% forecast and the February +0.2%). Later, after the close, Fed Balance Sheet showed a $32 billion drawdown (from $7.438 trillion last week to $7.406 trillion this week).
In FOMC speak, Atlanta Fed President Bostic (a hawk) indicated that was no hurry to cut rates. Bostic said inflation would be returning to the Fed’s 2% target more slowly than most expected. However, he said, “for me, that’s okay … I’m not in a mad dash hurry to get there” (indicating that continued relatively strong economy and a slowly declining inflation was a good thing). He then hurt the market’s feelings (expectations) by saying, “I’m of the view that things are going to be slow enough this year that we won’t be in a position to reduce our rates towards … the end of the year.” He continued, “If we can keep those things going, and inflation has the signs that it is moving to that target, I’m happy to just stay where we are.” Elsewhere, New York Fed President Williams (hawkish lean) echoed a similar refrain, saying, “I definitely don’t feel urgency to cut interest rates” (given the strength of the economy). Williams continued, “I think eventually…interest rates will need to be lower at some point, but the timing of that is driven by the economy.”
After the close, ISRG, NFLX, and WAL all reported beats on both the revenue and earnings lines. Meanwhile, PPG missed on revenue while reporting in-line on earnings. It is worth noting that NFLX forward guidance disappointed and while they reported blow out subscriber growth in Q1 the said they will stop reporting subscriber growth in the future.
In stock news, on Thursday, GOOGL announced it had terminated 28 employees related to Wednesday’s employee sit-in protest of the company’s contract with the Israeli military. (Nine of the 28 had been arrested for refusing to leave GOOGL premises.) At the same time, the CEO of ME revealed (in a public filing) that they will take the company private. The CEO currently owns 20% of the total shares. Later, INTC announced it was the first chipmaker to complete the building of ASML’s new “High NA EUV” lithography machines. This gives INTC an edge in developing the next generation of denser chips over its competitors. (AMD was first to implement ASML’s previous generation of EUV machine and has enjoyed a technical edge since that time.) At the same time, UNH announced that its subsidiary unit (which was hacked in February) had suffered another issue processing batches of medical claims. However, UNH said the issue had been communicated to the customers involved and that the issue was resolved and the processing backlog was being eliminated. Later, a leading shareholder proxy advisory service recommended that shareholders vote against the reelection of five BRKB directors, citing concerns over both company climate change performance as well as general governance. (It is highly unlikely Warren Buffett loses a shareholder vote, since he himself owns 31.2% of the voting shares, nonetheless it is worth mentioning.)
Elsewhere, GOOGL announced it has consolidated its Research and DeepMind units to create one “Responsible AI” team. The division is tasked with all AI development and will be relocated to where the GOOGL AI models are being built and trained. In related news, META has released an early version of its new “Llama 3” AI model. At the same time, SNY said it would restructure its US commercial operations and cut an unknown number of jobs as part of “strategic streamlining.” After the close, NFLX said it experienced blowout subscriber growth in Q1, adding 9.33 million new subscribers. However, the company forecasted weaker growth in Q2.
In stock legal and governmental news, on Thursday, the Dutch military intelligence agency published a report claiming that ASML (and some other tech companies in the Netherlands) have been and are under increasing attack by Chinese human-based and cyber espionage. The report said, unsurprisingly, these Chinese attacks have increased since the 2023 ban on selling ASML technologies to China. Later, the Dept. of Commerce announced MU will receive $6.1 billion in grants to help pay for new US chip plants. These include new plants in NY and ID. At the same time, the state of MI began receiving public comment on a proposal (filed in March) to increase the output of a MPC refinery in Detroit. The public hearing to review comments is set for May 28. Later, the Attorneys General of KY and WV filed suit to block the EPA rules requiring a reduction in tailpipe emissions between 2026 and 2032. (The GOP officials say it is “legally flawed and unrealistic” to reduce emissions by almost 50% over eight years.) At the same time, JPM filed suit against Russian, state-owned VTB Bank to recover $439.5 million from an account blocked after Russia invaded Ukraine more than two years ago. Later, the House moved ahead on a bill to force ByteDance to sell TikTok to a US owner or ban it from the US. (If the bill becomes law, CG, SQCF, and other major shareholders of ByteDance could be negatively impacted by a sale at “forced sale” prices.)
Elsewhere, JNJ won a FL trial brought by the family of a woman who died of ovarian cancer in 2019. The family had claimed JNJ talc had caused the cancer, but the jury was unconvinced. At the same time, a bipartisan US House committee released the findings of an investigation of US financial firms. The report found US finance firms (in particular BLK and MSCI) facilitated $6.5 billion of investments in blacklisted Chinese firms. The report called for legislation to ban such investments in sanctioned firms. Later, a US judge ruled BNPQY must face a lawsuit alleging the French bank aided the Sudan government commit genocide between 1997 and 2011 by providing banking services that were then prohibited by US law. The judge said there were too many fact linking the bank funding to the government abuses over the period. (The bank paid a $8.9 billion penalty to the US in 2014 to settle charges of criminal liability over the same actions. This civil case is being brought by Sudanese victims.)
Overnight, Asian markets were heavily on the red side with only two of 12 exchanges in the green. Taiwan (-3.81%), Japan (-2.66%), and Thailand (-2.13%) led the region lower. Meanwhile, in Europe, we see a similar picture taking shape with only three of 15 bourses in the green at midday. The CAC (-0.41%), DAX (-0.81%), and FTSE (-0.71%) lead the region lower in early afternoon trade. In the US, as of 7:30 a.m., Futures are pointing toward a down open to start Friday. The DIA implies a -0.21% open, the SPY is implying a -0.34% open, and the QQQ implies a -0.51% open at this hour. At the same time, 10-year bond yields are down to 4.596% and Oil (WTI) is actually off 0.97% to $81.93 per barrel. All of these moves and numbers were largely precipitated by Israel’s retaliatory strike (for Iran’s retaliatory strike) on Iran and worry over another retaliation and escalation.
There is no major economic news scheduled for Friday. However, the major earnings reports scheduled for before the open include AXP, FITB, HBAN, PG, RF, SLB, and WIT. There are no major reports scheduled for after the close.
In miscellaneous news, Reuters reported Thursday afternoon that MCO (Moody’s) has noted that creditors have begun to demand extra protection and clamped down on “creative financing” techniques of junk-rated corporate loans. (Previous corporate loan documentation did not prohibit “double dipping,” which is where a company has one of its financing subsidiary’s obtain money, using the guarantee of the parent company to secure the loan. The subsidiary then turns around and loans the money raised to the parent corporation. The parent then uses the raised money as collateral to obtain yet another loan. Elsewhere, a bi-partisan group of Senators proposed legislation to accelerate the development of nuclear fusion reactors to provide the power to help meet growing demand as well as the needs of climate change-related power needs. Finally, it was widely reported that the MAGA faction and House Speaker Johnson had a surreal shouting match (in hushed tones but very animated) away from reporters but directly under visitors in the gallery of the House Floor. Reporting suggests Speaker Johnson will call votes on the three aid bills plus the TikTok ban bill Saturday and send them to the Senate…where they will have to be revoted for passage. The “Freedom Caucus” (and MTG in particular) threatened Thursday to make her motion to vacate privileged, which due to recess would call a Speaker vote sometime around the end of the month. (Betting is that the Democrats would save Johnson as compensation for him calling the foreign aid votes over the objections of the fringe elements of his own party.)
So far this morning, AXP, FITB, HBAN, SLB, and WIT all reported beats on both the revenue and earnings lines. Meanwhile, PG missed on revenue while beating on earnings. On the other side, RF beat on revenue while missing on earnings. It is worth noting that PG has raised its forward guidance.
With that background, it looks as if the markets were scared by the Israeli attack (and/or news that the US had “signed off” on Israel’s plans for invading the Gaza city of Rafah in a way that purportedly will remove the civilians block by block rather than a wholesale attack from all directions). At any rate, the three major index ETFs gapped lower to start the premarket. However, all three have put in significant white-body candles and are now at the highs of the early session in what seems to be a notable rebound. In fact, all three are barely in the red at this point. (Perhaps rethinking how bad the geopolitical news is or expecting a flight to safety into US bonds and equities.) However, the SPY, DIA, and QQQ all remain well below their T-line. So the short-term trend is bearish. Meanwhile, the mid-term has also turned bearish and the longer-term market remains Bullish but trend is broken and is clearly under pressure. In terms of extension, the SPY and QQQ are a bit extended below their T-line but DIA is fine. Still, the T2122 indicator remains deep in its oversold range. So, at the very least, the Bears are in need of some more rest. (Just remember markets can remain oversold a lot longer than we can stay solvent predicting a reversal.) In terms of those 10 big dog tickers, eight of the 10 are in the red with NFLX (-5.75%) leading the move lower. However, the biggest of the big dogs, NVDA (+0.06%) is barely hanging onto green. (NVDA trades 2.5-3 times as much dollar volume than any other ticker, so it carries a big stick.) With all of this said, remember that it is Friday (and an options expiration Friday at that). So prepare your account for a weekend of (geopolitical?) news and perhaps political news in the US related to Speaker Johnson’s seat and US aid bills.
As always, be deliberate and disciplined…but don’t be stubborn. If you have a loss, admit you were wrong and take that loss before it gets out of hand. And when the price does move in your direction, always move your stops in your favor and take a little profit off the table. You have to keep the “Legend of the Man in the Green Bathrobe” in mind. In a winning situation, it is NOT HOUSE MONEY you’re betting, it’s YOUR MONEY! There is no reason to keep raising your bet (risk) size just because you’ve had a win. Finally, remember that trading is not a hobby, it’s a job. The gains are real and so is the risk. So, treat it that way. Do the work and follow the process. Stick to your trading rules, trade with the trend, and take those profits when you have them. Do the work!
See you in the trading room.
Ed
🎯 Mike Probst: Rick, Got CTL off the scanner today. Already up 30%. Love it.
🎯 Dick Carp: the scanner paid for the year with HES-thank you
🎯 Arnoldo Bolanos: LTA scanner really works $$, thanks Ed.
🎯 Bob S: LTA is incredible…. I use it … would not trade without it
🎯 Malcolm .: Posted in room 2, @Rick… I used the LTA Scanner to go through hundreds of stocks this weekend and picked out three to trade: PYPL, TGT, and ZS. Quality patterns and with my trading, up 24%, 7% and 12%…. this program is gold.
🎯 Friday 6/21/19 (10:09 am) Aaron B: Today, my account is at +190% since January. Thanks, RWO HRC Flash Malcolm Thomas Steve Ed Bob S Bob C Mike P and everyone that contributes every day. I love our job.
Hit and Run Candlesticks / Road To Wealth Youtube videos
Disclosure: We do not act on all trades we mention, and not all mentions acted on the day of the mention. All trades we mention are for your consideration only.
Free YouTube Education • Subscription Plans • Private 2-Hour Coaching
DISCLAIMER: Investing / Trading involves significant financial risk and is not suitable for everyone. No communication from Hit and Run Candlesticks Inc, its affiliates or representatives is not financial or trading advice. All information provided by Hit and Run Candlesticks Inc, its affiliates and representatives are intended for educational purposes only. You are advised to test any new trading approach before implementing it. Past performance does not guarantee future results. Terms of Service


