
Two lines can meet in a number of ways: they might cross once, they might intersect multiple times, or they might form a single longer line. A pair of lines can also meet in a Japanese candlestick pattern. For example, if two side-by-side candles close at the same price, they form a Meeting Lines signal. We have already discussed the Bullish Meeting Lines pattern, which forms during a downtrend and predicts a reversal. However, there is also a Bearish Meeting Lines candlestick pattern, which, as you might expect, forms during an uptrend. This is an uncomplicated and straightforward pattern—as scarce as hen’s teeth (i.e., quite rare), yet not especially reliable either. To be sure that you don’t mistake this pattern for another (or vice versa), review the Bearish Meeting Lines candlestick pattern below.
Bearish Meeting Lines Candlestick Pattern
FORMATION
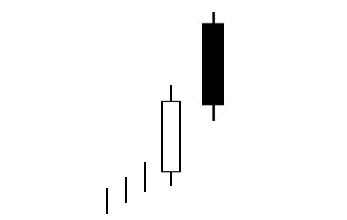
Two candles form the Bearish Meeting Lines signal: one black and one white. Look for the following criteria to identify it:
First, an uptrend must be in progress. Second, a long-bodied white candle must appear. Third, a long-bodied black candle must follow the white candle. Fourth and finally, the black candle must close at the same price that the white candle closed (or very near to it)—this is the meeting of the two candles.
As we mentioned above, there is a bullish version of this pattern in which the black candle comes first, but the candles still meet at the close. To learn more about that signal, review this previous blog post. The Bearish Meeting Lines is also similar to the Dark Cloud Cover pattern, which forms during an uptrend and also features a white candle followed by a black candle. However, in a Dark Cloud Cover signal, the candles do not close at the same place.
MEANING
So what’s happening during a Bearish Meeting Lines signal? To start, the market is bullish, an uptrend in progress, and a white candle continues this upward movement. The following day, the market opens sharply higher, forming a gap up and bolstering the bulls’ confidence. However, the price then dips, closing at the same place the previous day closed. A stalemate has occurred between the bulls and the bears.
Some call the Bearish Meeting Lines candlestick pattern random, because despite its bearish disposition, it acts as a bullish continuation pattern approximately half of the time. The signal is most significant if it occurs after a prolonged uptrend.
_____
As it requires a very specific and precise configuration, the Bearish Meeting Lines pattern occurs very infrequently. When you do spot it, as with all candlestick patterns, be sure to confirm its forecast before making significant trades in response. To do so, watch for the price to cross below the last close. Good luck!
If you’re interested in mastering some simple but effective swing trading strategies, check out Hit & Run Candlesticks. Our methods are simple, yet powerful. We look for stocks positioned to make an unusually large percentage move, using high percentage profit patterns as well as powerful Japanese Candlesticks. Our services include coaching with experienced swing traders, training clinics, and daily trading ideas. To sign up for a membership, please click here.


Comments are closed.