
Last Updated: November 10, 2016
It was a bit unfair of us (a “hit below the belt,” you might say) to introduce you to the Bullish Belt Hold candlestick pattern without giving its brother, the Bearish Belt Hold candlestick pattern, an equal amount of time in the spotlight. It was mentioned offhand, in a two-sentence paragraph, but that’s hardly enough time to fully explain the appearance and implications of this bearish signal.
Formed at the end of an uptrend and signaling a potential reverse in investor sentiment, the Bearish Belt Hold pattern is easy to spot, but it isn’t foolproof. Ready to learn more about its characteristics and meaning? Let’s get started . . .
Bearish Belt Hold Candlestick Pattern
Formation
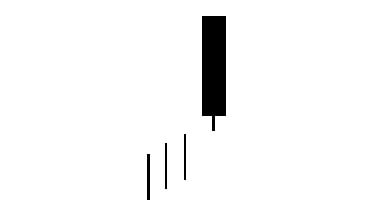
The Bearish Belt Hold pattern is formed of a single candlestick, making it easy to identify. It can act as a top reversal pattern, though you should always confirm its presence before making a rash move. Like the Marubozu candlestick (and the Bullish Belt Hold signal, of course), the Bearish Belt Hold’s significance can be found in the size of its candle as opposed to its wicks (which are either very small or nonexistent).
To spot a Bearish Belt Hold candlestick pattern, be on the hunt for the following criteria:
First, the preceding candlesticks should be in a clear uptrend. Second, a bearish (black) candlestick must occur after this stretch of bullish (white) candlesticks. The weight of the signal hangs on this candlestick’s size and location. Third, the black candlestick should be somewhat long and have a short lower shadow (or no lower shower at all). Fourth and finally, the black candlestick should lack an upper shadow entirely.
Meaning
So what does this all mean? Well, the price has been steadily rising over the past trading sessions, creating a firm uptrend. The bulls possess control of the market. This trend seems to continue, because the opening price of the next candlestick is at the high of the session. However, the price declines during the session and closes at (or near) the low of the session, forming a black, bearish candlestick. The candle indicates that investor sentiment has changed and the price may continue to drop in future sessions.
Since this signal is so simple, it helps to learn about its details. To better understand a Bearish Belt Hold signal, look for these characteristics:
- The longer the candle is, the more powerful and significant it is.
- To confirm the signal, the pattern should be followed by a bearish candlestick in the next session.
EXAMPLES
Learning about the Bearish Belt Hold signal’s structure and implications is all well and good, but do you think you would know what to do if you saw this pattern “in the wild?” To test your understanding, take a look at the examples we’ve assembled below. Although these samples are labeled, making it easy to pinpoint the Bearish Belt Hold candlestick pattern within each chart, be honest with yourself regarding your abilities. Could you spot these signals without the helpful blue arrows? Would you have been able to anticipate the candles that follow? Use these real-world examples to test your knowledge.
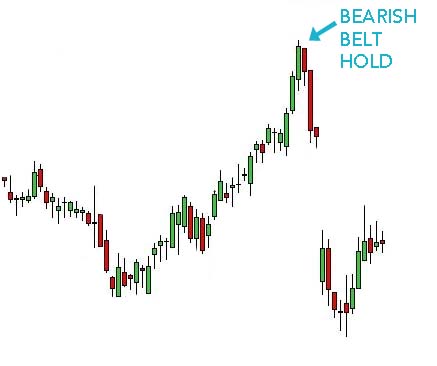
Example 1:
We don’t need to direct your attention to the uptrend in this chart, as it will surely grab your eye on its own. It is bold, long, and conspicuous. This upward trajectory, which takes up most of the chart, sets the stage for the Bearish Belt Hold to come. The bulls’ extensive control of the market ends with a long bearish candlestick: the Belt Hold. It lacks an upper shadow but includes a small lower shadow, and it is somewhat long (though not as long as the candles on either side of it). Another, lengthier red candle confirms the coming downtrend, which leads to an enormous gap down. Any investors who placed their faith in the Bearish Belt Hold reaped the benefits of the reversal.
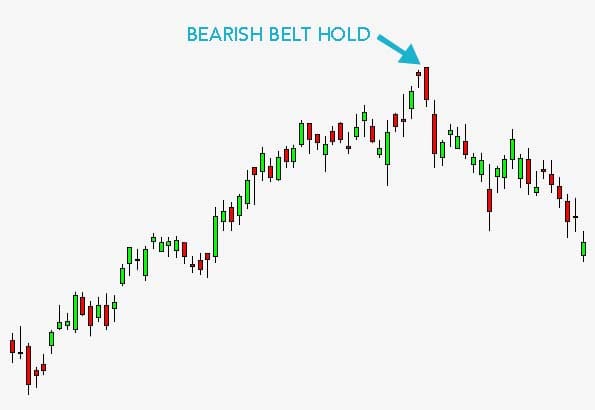
Example 2:
Although the bears manage to push the price down from time to time in this example, the bulls succeed in developing a massive uptrend. They keep chugging along, raising the price higher and higher, until a long red candle appears. The Bearish Belt Hold doesn’t have an upper wick, and its length conveys its power. Immediately afterward, the price drops. In fact, it gaps down and another long red candle forms, confirming the reversal heralded by the Bearish Belt Hold. Although the bulls take the reins briefly after that, a downtrend follows, as predicted.
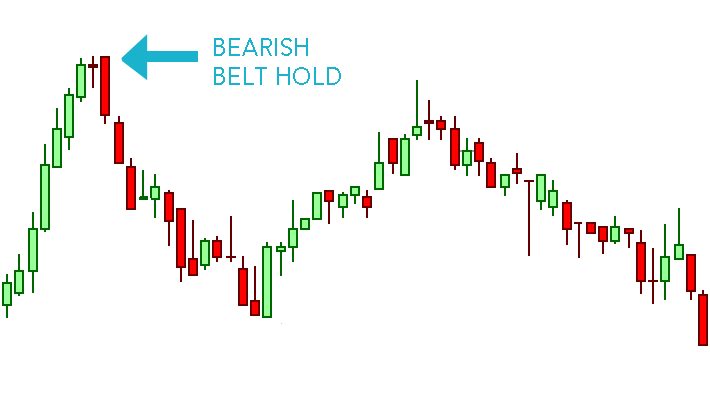
Example 3:
This example wastes no time whatsoever! When we enter the scene, the bulls hold sway over the market. Without any intervention from the bears, they sharply increase the price at the start of the chart. In fact, nearly all of the candles within the uptrend are lengthy, creating a confident stride to the top. However, following one doji with long wicks, the Bearish Belt Hold candlestick pattern appears. The bears, with a firm grasp on the market, make three big jumps downward. This confirms the Bearish Belt Hold and begins the market’s downward trajectory.
P.S. Can you spot a Bullish Belt Hold in this example as well? Where is it located, and what sort of forecast does it predict? Most importantly, does its forecast hold true?
—–
Like its bullish counterpart, the Bearish Belt Hold is not the clearest and most influential of candlestick patterns. Thus, we don’t advise you to trust it inherently or make any rash moves. Instead, be prudent and patient, analyzing the surrounding trading sessions and waiting for confirmation before you move ahead with your prediction.
If you’re interested in mastering some simple but effective swing trading strategies, check out Hit & Run Candlesticks. Our methods are simple, yet powerful. We look for stocks positioned to make an unusually large percentage move, using high percentage profit patterns as well as powerful Japanese Candlesticks. Our services include coaching with experienced swing traders, training clinics, and daily trading ideas. To sign up for a membership, please click here.


Comments are closed.